Integrate AWS EKS with AMP using Self-managed Collector and AMG
2024年02月16日
With Amazon Managed Grafana, you create logically isolated Grafana servers called workspaces. Then, you can create Grafana dashboards and visualizations to analyze your metrics, logs, and traces without having to build, package, or deploy any hardware to run your Grafana servers.
Amazon Managed Grafana manages the provisioning, setup, scaling, and maintenance of your logical Grafana servers so that you don't have to do these tasks yourself. Amazon Managed Grafana also provides built-in security features for compliance with corporate governance requirements, including single sign-on, data access control, and audit reporting.
Amazon Managed Grafana is integrated with AWS data sources that collect operational data, such as Amazon CloudWatch, Amazon OpenSearch Service, AWS X-Ray, AWS IoT SiteWise, Amazon Timestream, and Amazon Managed Service for Prometheus. Amazon Managed Grafana includes a permission provisioning feature for adding supported AWS services as data sources. Amazon Managed Grafana also supports many popular open-source, third-party, and other cloud data sources.
For user authentication and authorization, Amazon Managed Grafana can integrate with identity providers (IdPs) that support SAML 2.0 and also can integrate with AWS IAM Identity Center.
AMG is priced per active user in a workspace. For information about pricing, see Amazon Managed Grafana Pricing.
The following architecture illustrates how the container obersability solution is setup for the tianzhui.cloud site.
The following diagram illustrates the Prometheus inside architecture. This picture is from the Prometheus official web-site.

When you use your own collectors to send metrics to AMP, you are responsible for securing your metrics and making sure that the ingestion process meets your availability needs.
Most customer-managed collectors use one of the following tools:
Warning
Avoid exposing Prometheus Scrape endpoints to the public internet by enabling security features.
If you set up multiple Prometheus instances that monitor the same set of metrics and sent them to a single AMP workspace for high availability, you need to set up deduplication. If you don't follow the steps to set up deduplication, you will be charged for all data samples sent to AMP, including duplicate samples. For instructions about setting up deduplication, see Deduplicating high availability metrics sent to Amazon Managed Service for Prometheus.
Check Helm CLI version
% helm version
Note
For more information about these commands, see Helm Repo.
% helm repo add prometheus-community https://prometheus-community.github.io/helm-charts
% helm repo add kube-state-metrics https://kubernetes.github.io/kube-state-metrics
% helm repo update
% kubectl create namespace prometheus
With IAM roles for service accounts, you can associate an IAM role with a Kubernetes service account. This service account can then provide AWS permissions to the containers in any pod that uses that service account. For more information, see IAM roles for service accounts.
If you have not already set up these roles, follow the instructions at Set up service roles for the ingestion of metrics from Amazon EKS clusters to set up the roles. The instructions in that section require the use of
Note
When you are not on EKS or AWS and using just access key and secret key to access Amazon Managed Service for Prometheus, you cannot use the
Replace
% touch createIRSA-AMPIngest.sh
Content of the "createIRSA-AMPIngest.sh" file:
2. Enter the following command to give the script the necessary privileges.
% chmod +x createIRSA-AMPIngest.sh
3. Run the script.
% ./createIRSA-AMPIngest.sh
% touch prometheus_values.yaml
Content of the "prometheus_values.yaml" file:
Note
For detailed information regarding Prometheus Agent Mode, refer to another blog post: .
2. Update the exising Helm deployment for aws-load-balancer-controller.
VPC_ID=<VPC-ID>
https://github.com/aws/eks-charts/tree/master/stable/aws-load-balancer-controller
2. Create the Prometheus server in Agent Mode.
% REGION=<Region-code>
% WORKSPACE_ID=<AMP-Workspace-ID>
% IAM_PROXY_PROMETHEUS_ROLE_ARN=<IAM-role-ARN>
% helm install prometheus prometheus-community/prometheus -n prometheus \
-f prometheus_values.yaml \
--set 'serviceAccounts.server.annotations.eks\.amazonaws\.com/role-arn'=$IAM_PROXY_PROMETHEUS_ROLE_ARN \
--set 'serverFiles.prometheus\.yml.remote_write[0].sigv4.region'=${REGION} \
--set 'serverFiles.prometheus\.yml.remote_write[0].url'=https://aps-workspaces.${REGION}.amazonaws.com/workspaces/${WORKSPACE_ID}/api/v1/remote_write
or run:
% helm install prometheus prometheus-community/prometheus -n prometheus \
-f prometheus_values.yaml \
--set serviceAccounts.server.annotations.'eks\.amazonaws\.com/role-arn'=$IAM_PROXY_PROMETHEUS_ROLE_ARN \
--set serverFiles.'prometheus\.yml'.'remote_write[0]'.sigv4.region=${REGION} \
--set serverFiles.'prometheus\.yml'.'remote_write[0]'.url=https://aps-workspaces.${REGION}.amazonaws.com/workspaces/${WORKSPACE_ID}/api/v1/remote_write
The difference is the quotation marks.
To upgrade an existing Prometheus, you can run:
% helm upgrade prometheus prometheus-community/prometheus -n prometheus \
-f prometheus_values.yaml \
--set serviceAccounts.server.annotations.'eks\.amazonaws\.com/role-arn'=$IAM_PROXY_PROMETHEUS_ROLE_ARN \
--set 'serverFiles.prometheus\.yml.remote_write[0].sigv4.region'=${REGION} \
--set 'serverFiles.prometheus\.yml.remote_write[0].url'=https://aps-workspaces.${REGION}.amazonaws.com/workspaces/${WORKSPACE_ID}/api/v1/remote_write
% k get po -n prometheus
Note
Starting with version 16.0, the Prometheus chart requires Helm 3.7+ in order to install successfully. Please check your
helm install [RELEASE_NAME] prometheus-community/prometheus
Note
When property names contain special characters, they do not require any special syntax in a
Helm requires these characters to be escaped:
Quotation marks are required to prevent shell interpreting the
Note
To remove the Prometheus deployment:
% helm uninstall prometheus -n prometheus
Note
You can customize the
% export POD_NAME=$(kubectl get pods --namespace prometheus -l "app.kubernetes.io/name=prometheus,app.kubernetes.io/instance=prometheus" -o jsonpath="{.items[0].metadata.name}")
% kubectl --namespace prometheus port-forward $POD_NAME 9090
% VPC_ID=<VPC-ID>
% AWS_REGION=<Region-code>
% SECURITY_GROUP_IDS=<security-group-IDs>
% SUBNET_IDS=<subnet-IDs>
Security Group rules of this SG:
2. Choose Create workspace.
3. For Workspace name, enter a name for the workspace.Optionally, enter a description for the workspace. Choose Next.
4. For Authentication access, select AWS IAM Identity Center.
AWS IAM Identity Center— If you select IAM Identity Center and you have not already enabled IAM Identity Center in your account, you are prompted to enable it by creating your first IAM Identity Center user. IAM Identity Center handles user management for access to Amazon Managed Grafana workspaces.To enable IAM Identity Center, follow these steps:
Choose Create user.
Enter an email address, first name, and last name for the user, and choose Create user. For this tutorial, use the name and email address of the account that you want to use to try out Amazon Managed Grafana. You will receive an email message prompting you to create a password for this account for IAM Identity Center.
Important
The user that you create does not automatically have access to your Amazon Managed Grafana workspace. You provide the user with access to the workspace in the workspace details page in a later step.
Choose Next.
5. For this first workspace, confirm that Service managed is selected for Permission type. This selection enables Amazon Managed Grafana to automatically provision the permissions you need for the AWS data sources that you choose to use for this workspace.
6. For this tutorial, choose Current account.
7. (Optional) Select the data sources that you want to query in this workspace. For this getting started tutorial, you do not need to select any data sources. However, if you plan to use this workspace with any of the listed data sources, select them here.
Selecting data sources enables Amazon Managed Grafana to create AWS Identity and Access Management (IAM) policies for each of the data sources so that Amazon Managed Grafana has permission to read their data. This does not completely set up these services as data sources for the Grafana workspace. You can do that within the Grafana workspace console.
8. (Optional) If you want Grafana alerts from this workspace to be sent to an Amazon Simple Notification Service (Amazon SNS) notification channel, select Amazon SNS. This enables Amazon Managed Grafana to create an IAM policy to publish to the Amazon SNS topics in your account with
Choose Next.
9. Confirm the workspace details, and choose Create workspace. The workspace details page appears. Initially, the Status is CREATING.
Important
Wait until the status is ACTIVE before doing either of the following:
10. If you are using IAM Identity Center, do the following:
Important
Assign at least one user as
11. In the workspace details page, choose the URL displayed under Grafana workspace URL.
12. Choosing the workspace URL takes you to the landing page for the Grafana workspace console.
Choose Sign in with AWS IAM Identity Center, and enter the email address and password of the user that you created earlier in this procedure. These credentials only work if you have responded to the email from AMG that prompted you to create a password for IAM Identity Center.
You are now in your Grafana workspace, or logical Grafana server. You can start adding data sources to query, visualize, and analyze data. For more information, see Working in your Grafana workspace.
Security Group rules of the SG for the AMG outbound VPC connections:
Content of the "prometheus_values.yaml" file:
% helm install prometheus prometheus-community/prometheus -n prometheus -f prometheus_values.yaml
Amazon Managed Service for Prometheus pricing
Amazon Managed Grafana pricing
Set up service roles for the ingestion of metrics from Amazon EKS clusters
Customer managed collectors
Set up ingestion from a new Prometheus server using Helm
Getting started with Amazon Managed Grafana
Helm Chart Install: Advanced Usage of the “Set” Argument
Helm: How to Override Value with Periods in Name
The Format and Limitations of --set
Introduction of Amazon Managed Grafana
Amazon Managed Grafana is a fully managed and secure data visualization service that you can use to instantly query, correlate, and visualize operational metrics, logs, and traces from multiple sources. Amazon Managed Grafana makes it easy to deploy, operate, and scale Grafana, a widely deployed data visualization tool that is popular for its extensible data support.With Amazon Managed Grafana, you create logically isolated Grafana servers called workspaces. Then, you can create Grafana dashboards and visualizations to analyze your metrics, logs, and traces without having to build, package, or deploy any hardware to run your Grafana servers.
Amazon Managed Grafana manages the provisioning, setup, scaling, and maintenance of your logical Grafana servers so that you don't have to do these tasks yourself. Amazon Managed Grafana also provides built-in security features for compliance with corporate governance requirements, including single sign-on, data access control, and audit reporting.
Amazon Managed Grafana is integrated with AWS data sources that collect operational data, such as Amazon CloudWatch, Amazon OpenSearch Service, AWS X-Ray, AWS IoT SiteWise, Amazon Timestream, and Amazon Managed Service for Prometheus. Amazon Managed Grafana includes a permission provisioning feature for adding supported AWS services as data sources. Amazon Managed Grafana also supports many popular open-source, third-party, and other cloud data sources.
For user authentication and authorization, Amazon Managed Grafana can integrate with identity providers (IdPs) that support SAML 2.0 and also can integrate with AWS IAM Identity Center.
AMG is priced per active user in a workspace. For information about pricing, see Amazon Managed Grafana Pricing.
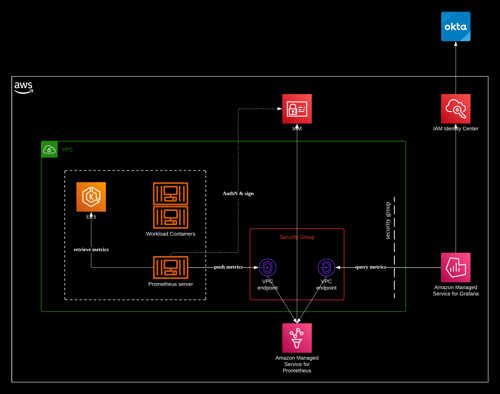
Architecture
The following architecture illustrates how the container obersability solution is setup for the tianzhui.cloud site.

The following diagram illustrates the Prometheus inside architecture. This picture is from the Prometheus official web-site.
Self-managed Collectors
This section contains information about ingesting data by setting up your own collectors that send metrics to Amazon Managed Service for Prometheus (AMP) using Prometheus remote write.When you use your own collectors to send metrics to AMP, you are responsible for securing your metrics and making sure that the ingestion process meets your availability needs.
Most customer-managed collectors use one of the following tools:
- AWS Distro for OpenTelemetry (ADOT) – ADOT is a fully supported, secure, production-ready open source distribution of OpenTelemetry that provides agents to collect metrics. You can use ADOT to collect metrics and send them to your AMP workspace. For more information about the ADOT Collector, see AWS Distro for OpenTelemetry.
- Prometheus agent – You can set up your own instance of the open source Prometheus server, running as an agent, to collect metrics and forward them to your AMP workspace.
Using a Prometheus Instance as a Collector
The following topics describe different ways to set up a Prometheus instance running in agent mode as a collector for your metrics.Warning
Avoid exposing Prometheus Scrape endpoints to the public internet by enabling security features.
If you set up multiple Prometheus instances that monitor the same set of metrics and sent them to a single AMP workspace for high availability, you need to set up deduplication. If you don't follow the steps to set up deduplication, you will be charged for all data samples sent to AMP, including duplicate samples. For instructions about setting up deduplication, see Deduplicating high availability metrics sent to Amazon Managed Service for Prometheus.
Setup Ingestion from a New Prometheus Server using Helm
The instructions in this section get you up and running with Amazon Managed Service for Prometheus quickly. You set up a new Prometheus server in an Amazon EKS cluster, and the new server uses a default configuration to send metrics to Amazon Managed Service for Prometheus. This method has the following prerequisites:- You must have an EKS cluster where the new Prometheus server will collect metrics from
- You must use Helm CLI 3.0 or later
- You must use a Linux or macOS computer to perform the steps in the following sections
Check Helm CLI version
% helm version
version.BuildInfo{Version:"v3.9.1", GitCommit:"a7c043acb5ff905c261cfdc923a35776ba5e66e4", GitTreeState:"clean", GoVersion:"go1.17.5"}
Step 1: Add new Helm chart repositories
To add new Helm chart repositories, enter the following commands.Note
For more information about these commands, see Helm Repo.
% helm repo add prometheus-community https://prometheus-community.github.io/helm-charts
"prometheus-community" already exists with the same configuration, skipping
% helm repo add kube-state-metrics https://kubernetes.github.io/kube-state-metrics
"kube-state-metrics" has been added to your repositories
% helm repo update
Hang tight while we grab the latest from your chart repositories...
...Successfully got an update from the "kube-state-metrics" chart repository
...
...Successfully got an update from the "prometheus-community" chart repository
Update Complete. ⎈Happy Helming!⎈
Step 2: Create a Prometheus namespace
Enter the following command to create a namespace for the Prometheus server and other monitoring components.% kubectl create namespace prometheus
namespace/prometheus created
Step 3: Set up IAM roles for service accounts
For the method of onboarding that we are documenting, you need to use IAM roles for service accounts in the Amazon EKS cluster where the Prometheus server is running.With IAM roles for service accounts, you can associate an IAM role with a Kubernetes service account. This service account can then provide AWS permissions to the containers in any pod that uses that service account. For more information, see IAM roles for service accounts.
If you have not already set up these roles, follow the instructions at Set up service roles for the ingestion of metrics from Amazon EKS clusters to set up the roles. The instructions in that section require the use of
eksctl. For more information, see Getting started with Amazon Elastic Kubernetes Service – eksctl.Note
When you are not on EKS or AWS and using just access key and secret key to access Amazon Managed Service for Prometheus, you cannot use the
EKS-IAM-ROLE based SigV4.Set up service roles for the ingestion of metrics from Amazon EKS clusters
To set up the service roles to enable Amazon Managed Service for Prometheus to ingest metrics from Prometheus servers in Amazon EKS clusters, you must be logged on to an account with the following permissions:iam:CreateRoleiam:CreatePolicyiam:GetRoleiam:AttachRolePolicyiam:GetOpenIDConnectProvider
To set up the service role for ingestion into Amazon Managed Service for Prometheus
1. Create a file namedcreateIRSA-AMPIngest.sh with the following content.Replace
<my_amazon_eks_clustername> with the name of your cluster, and replace <my_prometheus_namespace> with your Prometheus namespace.% touch createIRSA-AMPIngest.sh
Content of the "createIRSA-AMPIngest.sh" file:
#!/bin/bash -e
CLUSTER_NAME=<my_amazon_eks_clustername>
SERVICE_ACCOUNT_NAMESPACE=<my_prometheus_namespace>
AWS_ACCOUNT_ID=$(aws sts get-caller-identity --query "Account" --output text)
OIDC_PROVIDER=$(aws eks describe-cluster --name $CLUSTER_NAME --query "cluster.identity.oidc.issuer" --output text | sed -e "s/^https:\/\///")
SERVICE_ACCOUNT_AMP_INGEST_NAME=amp-iamproxy-ingest-service-account
SERVICE_ACCOUNT_IAM_AMP_INGEST_ROLE=amp-iamproxy-ingest-role
SERVICE_ACCOUNT_IAM_AMP_INGEST_POLICY=AMPIngestPolicy
#
# Set up a trust policy designed for a specific combination of K8s service account and namespace to sign in from a Kubernetes cluster which hosts the OIDC Idp.
#
cat <<EOF > TrustPolicy.json
{
  "Version": "2012-10-17",
  "Statement": [
    {
      "Effect": "Allow",
      "Principal": {
        "Federated": "arn:aws:iam::${AWS_ACCOUNT_ID}:oidc-provider/${OIDC_PROVIDER}"
      },
      "Action": "sts:AssumeRoleWithWebIdentity",
      "Condition": {
        "StringEquals": {
          "${OIDC_PROVIDER}:sub": "system:serviceaccount:${SERVICE_ACCOUNT_NAMESPACE}:${SERVICE_ACCOUNT_AMP_INGEST_NAME}"
        }
      }
    }
  ]
}
EOF
#
# Set up the permission policy that grants ingest (remote write) permissions for all AMP workspaces
#
cat <<EOF > PermissionPolicyIngest.json
{
  "Version": "2012-10-17",
   "Statement": [
       {"Effect": "Allow",
        "Action": [
           "aps:RemoteWrite",
           "aps:GetSeries",
           "aps:GetLabels",
           "aps:GetMetricMetadata"
        ],
        "Resource": "*"
      }
   ]
}
EOF

function getRoleArn() {
  OUTPUT=$(aws iam get-role --role-name $1 --query 'Role.Arn' --output text 2>&1)

  # Check for an expected exception
  if [[ $? -eq 0 ]]; then
    echo $OUTPUT
  elif [[ -n $(grep "NoSuchEntity" <<< $OUTPUT) ]]; then
    echo ""
  else
    >&2 echo $OUTPUT
    return 1
  fi
}

#
# Create the IAM Role for ingest with the above trust policy
#
SERVICE_ACCOUNT_IAM_AMP_INGEST_ROLE_ARN=$(getRoleArn $SERVICE_ACCOUNT_IAM_AMP_INGEST_ROLE)
if [ "$SERVICE_ACCOUNT_IAM_AMP_INGEST_ROLE_ARN" = "" ];
then
  #
  # Create the IAM role for service account
  #
  SERVICE_ACCOUNT_IAM_AMP_INGEST_ROLE_ARN=$(aws iam create-role \
  --role-name $SERVICE_ACCOUNT_IAM_AMP_INGEST_ROLE \
  --assume-role-policy-document file://TrustPolicy.json \
  --query "Role.Arn" --output text)
  #
  # Create an IAM permission policy
  #
  SERVICE_ACCOUNT_IAM_AMP_INGEST_ARN=$(aws iam create-policy --policy-name $SERVICE_ACCOUNT_IAM_AMP_INGEST_POLICY \
  --policy-document file://PermissionPolicyIngest.json \
  --query 'Policy.Arn' --output text)
  #
  # Attach the required IAM policies to the IAM role created above
  #
  aws iam attach-role-policy \
  --role-name $SERVICE_ACCOUNT_IAM_AMP_INGEST_ROLE \
  --policy-arn $SERVICE_ACCOUNT_IAM_AMP_INGEST_ARN
else
    echo "$SERVICE_ACCOUNT_IAM_AMP_INGEST_ROLE_ARN IAM role for ingest already exists"
fi
echo $SERVICE_ACCOUNT_IAM_AMP_INGEST_ROLE_ARN
#
# EKS cluster hosts an OIDC provider with a public discovery endpoint.
# Associate this IdP with AWS IAM so that the latter can validate and accept the OIDC tokens issued by Kubernetes to service accounts.
# Doing this with eksctl is the easier and best approach.
#
eksctl utils associate-iam-oidc-provider --cluster $CLUSTER_NAME --approve
2. Enter the following command to give the script the necessary privileges.
% chmod +x createIRSA-AMPIngest.sh
3. Run the script.
% ./createIRSA-AMPIngest.sh
arn:aws:iam::<111122223333>:role/amp-iamproxy-ingest-role
2024-02-16 16:22:48 [ℹ]  IAM Open ID Connect provider is already associated with cluster "example" in "us-west-2"
Step 4: Set up the new server and start ingesting metrics
To install the new Prometheus server that sends metrics to your Amazon Managed Service for Prometheus workspace, follow these steps.To install a new Prometheus server to send metrics to your Amazon Managed Service for Prometheus workspace
1. Use a text editor to create a file namedprometheus_values.yaml with the following content.
- Replace
IAM_PROXY_PROMETHEUS_ROLE_ARNwith the ARN of the amp-iamproxy-ingest-role created in the "set up service roles for the ingestion of metrics from Amazon EKS clusters" section above. - Replace
WORKSPACE_IDwith the ID of your Amazon Managed Service for Prometheus workspace. - Replace
REGIONwith the Region of your AMP workspace.
% touch prometheus_values.yaml
Content of the "prometheus_values.yaml" file:
## The following is a set of default values for prometheus server helm chart which enable remoteWrite to AMP
## For the rest of prometheus helm chart values see: https://github.com/prometheus-community/helm-charts/blob/main/charts/prometheus/values.yaml
##
serviceAccounts:
  server:
    name: amp-iamproxy-ingest-service-account

alertmanager:
  enabled: false

kube-state-metrics:
  enabled: true

prometheus-node-exporter:
  enabled: true

prometheus-pushgateway:
  enabled: false

defaultRules:
  create: false

server:
  # Additional server configurations
  defaultFlagsOverride:
  - --config.file=/etc/config/prometheus.yml
  - --web.console.libraries=/etc/prometheus/console_libraries
  - --web.console.templates=/etc/prometheus/consoles
  - --web.enable-lifecycle
  - --enable-feature=agent

  # Enable Agent Mode
  extraArgs:
    enable-feature: agent

  # Disable persistent volume as Agent Mode doesn't require local storage
  persistentVolume:
    enabled: false

serverFiles:
  prometheus.yml:
    remote_write:
    - queue_config:
        capacity: 2500
        max_samples_per_send: 1000
        max_shards: 200
    rule_files: null
Note
For detailed information regarding Prometheus Agent Mode, refer to another blog post: .
2. Update the exising Helm deployment for aws-load-balancer-controller.
VPC_ID=<VPC-ID>
helm upgrade aws-load-balancer-controller eks/aws-load-balancer-controller \
  -n kube-system \
  --set clusterName=blog \
  --set serviceAccount.create=false \
  --set serviceAccount.name=aws-load-balancer-controller \
  --set region=us-west-2 \
  --set vpcId=${VPC_ID} \
  --set enableServiceMutatorWebhook=false
Release "aws-load-balancer-controller" has been upgraded. Happy Helming!
NAME: aws-load-balancer-controller
LAST DEPLOYED: Fri Feb 16 18:20:23 2024
NAMESPACE: kube-system
STATUS: deployed
REVISION: 3
TEST SUITE: None
NOTES:
AWS Load Balancer controller installed!
https://github.com/aws/eks-charts/tree/master/stable/aws-load-balancer-controller
| Parameter | Description | Default |
| enableServiceMutatorWebhook | If false, disable the Service Mutator webhook which makes all new services of type LoadBalancer reconciled by the lb controller |
true |
2. Create the Prometheus server in Agent Mode.
- Replace
prometheus-chart-namewith your Prometheus release name. For example, useprometheusas the release name for the Prometheus installation. - Replace
prometheus-namespacewith the name of your Prometheus namespace.
% REGION=<Region-code>
% WORKSPACE_ID=<AMP-Workspace-ID>
% IAM_PROXY_PROMETHEUS_ROLE_ARN=<IAM-role-ARN>
helm install <prometheus-chart-name> prometheus-community/prometheus -n <prometheus-namespace> \
 -f prometheus_values.yaml \
 --set serviceAccounts.server.annotations.'eks\.amazonaws\.com/role-arn'=$IAM_PROXY_PROMETHEUS_ROLE_ARN \
 --set 'serverFiles.prometheus\.yml.remote_write[0].sigv4.region'=${REGION} \
 --set 'serverFiles.prometheus\.yml.remote_write[0].url'=https://aps-workspaces.${REGION}.amazonaws.com/workspaces/${WORKSPACE_ID}/api/v1/remote_write
For example, to install Prometheus, you can run:% helm install prometheus prometheus-community/prometheus -n prometheus \
-f prometheus_values.yaml \
--set 'serviceAccounts.server.annotations.eks\.amazonaws\.com/role-arn'=$IAM_PROXY_PROMETHEUS_ROLE_ARN \
--set 'serverFiles.prometheus\.yml.remote_write[0].sigv4.region'=${REGION} \
--set 'serverFiles.prometheus\.yml.remote_write[0].url'=https://aps-workspaces.${REGION}.amazonaws.com/workspaces/${WORKSPACE_ID}/api/v1/remote_write
or run:
% helm install prometheus prometheus-community/prometheus -n prometheus \
-f prometheus_values.yaml \
--set serviceAccounts.server.annotations.'eks\.amazonaws\.com/role-arn'=$IAM_PROXY_PROMETHEUS_ROLE_ARN \
--set serverFiles.'prometheus\.yml'.'remote_write[0]'.sigv4.region=${REGION} \
--set serverFiles.'prometheus\.yml'.'remote_write[0]'.url=https://aps-workspaces.${REGION}.amazonaws.com/workspaces/${WORKSPACE_ID}/api/v1/remote_write
The difference is the quotation marks.
To upgrade an existing Prometheus, you can run:
% helm upgrade prometheus prometheus-community/prometheus -n prometheus \
-f prometheus_values.yaml \
--set serviceAccounts.server.annotations.'eks\.amazonaws\.com/role-arn'=$IAM_PROXY_PROMETHEUS_ROLE_ARN \
--set 'serverFiles.prometheus\.yml.remote_write[0].sigv4.region'=${REGION} \
--set 'serverFiles.prometheus\.yml.remote_write[0].url'=https://aps-workspaces.${REGION}.amazonaws.com/workspaces/${WORKSPACE_ID}/api/v1/remote_write
NAME: prometheus
LAST DEPLOYED: Wed Feb 21 12:37:23 2024
NAMESPACE: prometheus
STATUS: deployed
REVISION: 1
TEST SUITE: None
NOTES:
The Prometheus server can be accessed via port 80 on the following DNS name from within your cluster:
prometheus-server.prometheus.svc.cluster.local


Get the Prometheus server URL by running these commands in the same shell:
  export POD_NAME=$(kubectl get pods --namespace prometheus -l "app.kubernetes.io/name=prometheus,app.kubernetes.io/instance=prometheus" -o jsonpath="{.items[0].metadata.name}")
  kubectl --namespace prometheus port-forward $POD_NAME 9090
#################################################################################
######   WARNING: Persistence is disabled!!! You will lose your data when   #####
######            the Server pod is terminated.                             #####
#################################################################################


#################################################################################
######   WARNING: Pod Security Policy has been disabled by default since    #####
######            it deprecated after k8s 1.25+. use                        #####
######            (index .Values "prometheus-node-exporter" "rbac"          #####
###### .          "pspEnabled") with (index .Values                         #####
######            "prometheus-node-exporter" "rbac" "pspAnnotations")       #####
######            in case you still need it.                                #####
#################################################################################


For more information on running Prometheus, visit:
https://prometheus.io/
% k get po -n prometheus
NAME                                             READY   STATUS    RESTARTS   AGE
prometheus-kube-state-metrics-745b475957-8j7vz   1/1     Running   0          68m
prometheus-prometheus-node-exporter-kfspl        1/1     Running   0          77m
prometheus-prometheus-node-exporter-m8wwz        1/1     Running   0          77m
prometheus-prometheus-node-exporter-nb9kn        1/1     Running   0          77m
prometheus-prometheus-node-exporter-qxz9z        1/1     Running   0          77m
prometheus-prometheus-node-exporter-vldps        1/1     Running   0          77m
prometheus-server-7786957d4-v8r4k                2/2     Running   0          15h
Note
Starting with version 16.0, the Prometheus chart requires Helm 3.7+ in order to install successfully. Please check your
helm release before installation.helm install [RELEASE_NAME] prometheus-community/prometheus
Note
When property names contain special characters, they do not require any special syntax in a
values.yaml file. However, on the command line, you must use \ to escape special characters in the property name (key). These special characters that require escaping are defined in the Helm source code, i.e., ., [, ,, and =.Helm requires these characters to be escaped:
. [ , =Quotation marks are required to prevent shell interpreting the
\ character.Note
To remove the Prometheus deployment:
% helm uninstall prometheus -n prometheus
release "prometheus" uninstalled
Note
You can customize the
helm install command in many ways. For more information, see Helm install in the Helm documentation.% export POD_NAME=$(kubectl get pods --namespace prometheus -l "app.kubernetes.io/name=prometheus,app.kubernetes.io/instance=prometheus" -o jsonpath="{.items[0].metadata.name}")
% kubectl --namespace prometheus port-forward $POD_NAME 9090
Forwarding from 127.0.0.1:9090 -> 9090
Forwarding from [::1]:9090 -> 9090
Handling connection for 9090
Create a VPC Endpoint for AMP
% VPC_ID=<VPC-ID>
% AWS_REGION=<Region-code>
% SECURITY_GROUP_IDS=<security-group-IDs>
% SUBNET_IDS=<subnet-IDs>
aws ec2 create-vpc-endpoint \
--vpc-id ${VPC_ID} \
--service-name com.amazonaws.${AWS_REGION}.aps-workspaces \
--security-group-ids ${SECURITY_GROUP_IDS} \
--vpc-endpoint-type Interface \
--subnet-ids ${SUBNET_IDS}
Security Group rules of this SG:
| Rule type | Protocol | Ports | Source | Destination | Purpose |
|---|---|---|---|---|---|
| Inbound | All | All | EKS worker node SG | N/A | push metrics to AMP |
| Inbound | TCP | 443 | AMG outbound VPC connection SG | N/A | from AMG to AMP |
| Outbound | TCP | 443 | N/A | 0.0.0.0/0 | N/A |
Create AMG Workspace
Use the following steps to create an AMG workspace.To create a workspace in Amazon Managed Grafana
1. Open the Amazon Managed Grafana console at https://console.aws.amazon.com/grafana/.2. Choose Create workspace.
3. For Workspace name, enter a name for the workspace.Optionally, enter a description for the workspace. Choose Next.
4. For Authentication access, select AWS IAM Identity Center.
AWS IAM Identity Center— If you select IAM Identity Center and you have not already enabled IAM Identity Center in your account, you are prompted to enable it by creating your first IAM Identity Center user. IAM Identity Center handles user management for access to Amazon Managed Grafana workspaces.To enable IAM Identity Center, follow these steps:
Choose Create user.
Enter an email address, first name, and last name for the user, and choose Create user. For this tutorial, use the name and email address of the account that you want to use to try out Amazon Managed Grafana. You will receive an email message prompting you to create a password for this account for IAM Identity Center.
Important
The user that you create does not automatically have access to your Amazon Managed Grafana workspace. You provide the user with access to the workspace in the workspace details page in a later step.
Choose Next.
5. For this first workspace, confirm that Service managed is selected for Permission type. This selection enables Amazon Managed Grafana to automatically provision the permissions you need for the AWS data sources that you choose to use for this workspace.
6. For this tutorial, choose Current account.
7. (Optional) Select the data sources that you want to query in this workspace. For this getting started tutorial, you do not need to select any data sources. However, if you plan to use this workspace with any of the listed data sources, select them here.
Selecting data sources enables Amazon Managed Grafana to create AWS Identity and Access Management (IAM) policies for each of the data sources so that Amazon Managed Grafana has permission to read their data. This does not completely set up these services as data sources for the Grafana workspace. You can do that within the Grafana workspace console.
8. (Optional) If you want Grafana alerts from this workspace to be sent to an Amazon Simple Notification Service (Amazon SNS) notification channel, select Amazon SNS. This enables Amazon Managed Grafana to create an IAM policy to publish to the Amazon SNS topics in your account with
TopicName values that start with grafana. This does not completely set up Amazon SNS as a notification channel for the workspace. You can do that within the Grafana console in the workspace.Choose Next.
9. Confirm the workspace details, and choose Create workspace. The workspace details page appears. Initially, the Status is CREATING.
Important
Wait until the status is ACTIVE before doing either of the following:
- Completing the SAML setup, if you are using SAML.
- Assigning your IAM Identity Center users access to the workspace, if you are using IAM Identity Center.
10. If you are using IAM Identity Center, do the following:
- In the Authentication tab, choose Assign new user or group.
- Select the check box next to the user that you want to grant workspace access to, and choose Assign users and groups.
- Select the check box next to the user, and choose Make admin.
Important
Assign at least one user as
Admin for each workspace, in order to sign in to the Grafana workspace console to manage the workspace.11. In the workspace details page, choose the URL displayed under Grafana workspace URL.
12. Choosing the workspace URL takes you to the landing page for the Grafana workspace console.
Choose Sign in with AWS IAM Identity Center, and enter the email address and password of the user that you created earlier in this procedure. These credentials only work if you have responded to the email from AMG that prompted you to create a password for IAM Identity Center.
You are now in your Grafana workspace, or logical Grafana server. You can start adding data sources to query, visualize, and analyze data. For more information, see Working in your Grafana workspace.
Use AWS data source configuration to add Amazon Managed Service for Prometheus as a data source
To use AWS data source configuration, first you use the Amazon Managed Grafana (AMG) console to enable service-managed IAM roles that grant the workspace the IAM policies necessary to read the AMP resources in your account or in your entire organizational units. Then you use the AMG workspace console to add AMP as a data source.Use AWS data source configuration to add Amazon Managed Service for Prometheus as a data source
- Open the AMG console. In the upper left corner of the page, choose the menu icon and then choose All workspaces.
- Choose the name of the workspace.
- If you didn't choose to use service-managed permissions for this workspace when you created it, then change from using customer-managed permissions to use service-managed permissions to ensure that the proper IAM roles and policies are enabled for using the AWS data source configuration option in the Grafana workspace console. To do so, choose the edit icon by IAM role and then choose Service managed, Save changes. For more information, see Amazon Managed Grafana permissions and policies for AWS data sources.
- Choose the Data sources tab again, and then choose Configure in Grafana in the Amazon Managed Service for Prometheus row.
- Sign into the Grafana workspace console using IAM Identity Center if necessary.
- In the left navigation bar in the Grafana workspace console, choose the AWS icon and then choose AWS services, Prometheus.
- Select the Region that you want Amazon Managed Grafana to search to discover Amazon Managed Service for Prometheus workspaces, and then select the accounts and Amazon Managed Service for Prometheus workspaces that you want to add, and then choose Add data source.
Security Group rules of the SG for the AMG outbound VPC connections:
| Rule type | Protocol | Ports | Source | Destination | Purpose |
|---|---|---|---|---|---|
| Inbound | N/A | N/A | N/A | N/A | N/A |
| Outbound | TCP | 443 | N/A | AMP VPC endpoint SG | from AMG to AMP |
Appendix
Install the whole suite of Prometheus:Content of the "prometheus_values.yaml" file:
## The following is a set of default values for prometheus server helm chart which enable remoteWrite to AMP
## For the rest of prometheus helm chart values see: https://github.com/prometheus-community/helm-charts/blob/main/charts/prometheus/values.yaml
##
serviceAccounts:
  server:
    name: amp-iamproxy-ingest-service-account
    annotations:
      eks.amazonaws.com/role-arn: ${IAM_PROXY_PROMETHEUS_ROLE_ARN}
server:
  remoteWrite:
    - url: https://aps-workspaces.${REGION}.amazonaws.com/workspaces/${WORKSPACE_ID}/api/v1/remote_write
      sigv4:
        region: ${REGION}
      queue_config:
        max_samples_per_send: 1000
        max_shards: 200
        capacity: 2500
% helm install prometheus prometheus-community/prometheus -n prometheus -f prometheus_values.yaml
NAME: prometheus
LAST DEPLOYED: Fri Feb 16 18:24:50 2024
NAMESPACE: prometheus
STATUS: deployed
REVISION: 1
TEST SUITE: None
NOTES:
The Prometheus server can be accessed via port 80 on the following DNS name from within your cluster:
prometheus-server.prometheus.svc.cluster.local


Get the Prometheus server URL by running these commands in the same shell:
  export POD_NAME=$(kubectl get pods --namespace prometheus -l "app.kubernetes.io/name=prometheus,app.kubernetes.io/instance=prometheus" -o jsonpath="{.items[0].metadata.name}")
  kubectl --namespace prometheus port-forward $POD_NAME 9090


The Prometheus alertmanager can be accessed via port 9093 on the following DNS name from within your cluster:
prometheus-alertmanager.prometheus.svc.cluster.local


Get the Alertmanager URL by running these commands in the same shell:
  export POD_NAME=$(kubectl get pods --namespace prometheus -l "app.kubernetes.io/name=alertmanager,app.kubernetes.io/instance=prometheus" -o jsonpath="{.items[0].metadata.name}")
  kubectl --namespace prometheus port-forward $POD_NAME 9093
#################################################################################
######   WARNING: Pod Security Policy has been disabled by default since    #####
######            it deprecated after k8s 1.25+. use                        #####
######            (index .Values "prometheus-node-exporter" "rbac"          #####
###### .          "pspEnabled") with (index .Values                         #####
######            "prometheus-node-exporter" "rbac" "pspAnnotations")       #####
######            in case you still need it.                                #####
#################################################################################


The Prometheus PushGateway can be accessed via port 9091 on the following DNS name from within your cluster:
prometheus-prometheus-pushgateway.prometheus.svc.cluster.local


Get the PushGateway URL by running these commands in the same shell:
  export POD_NAME=$(kubectl get pods --namespace prometheus -l "app=prometheus-pushgateway,component=pushgateway" -o jsonpath="{.items[0].metadata.name}")
  kubectl --namespace prometheus port-forward $POD_NAME 9091

For more information on running Prometheus, visit:
https://prometheus.io/
References
Amazon Managed Service for Prometheus pricing
Amazon Managed Grafana pricing
Set up service roles for the ingestion of metrics from Amazon EKS clusters
Customer managed collectors
Set up ingestion from a new Prometheus server using Helm
Getting started with Amazon Managed Grafana
Helm Chart Install: Advanced Usage of the “Set” Argument
Helm: How to Override Value with Periods in Name
The Format and Limitations of --set