AWS Glue, Athena, and QuickSight - Get Insights into New York City Taxi Records
2018年12月19日
Data Analytics Services Architecture

Explain Sample Data
In each trip record dataset, one row represents a single trip made by a TLC-licensed vehicle.
Yellow
Trips made by New York City’s iconic yellow taxis have been recorded and provided to the TLC since 2009. Yellow taxis are traditionally hailed by signaling to a driver who is on duty and seeking a passenger (street hail), but now they may also be hailed using an e-hail app like Curb or Arro. Yellow taxis are the only vehicles permitted to respond to a street hail from a passenger in all five boroughs.
Records include fields capturing pick-up and drop-off dates/times, pick-up and drop-off locations, trip distances, itemized fares, rate types, payment types, and driver-reported passenger counts. The records were collected and provided to the NYC TLC by technology service providers. The trip data was not created by the TLC, and TLC cannot guarantee their accuracy.
样例数据展示
s3://serverless-analytics/glue-blog/yellow/yellow_tripdata_2016-01.csv
Data dictionary
Green
Green taxis, also known as boro taxis and street-hail liveries, were introduced in August of 2013 to improve taxi service and availability in the boroughs. Green taxis may respond to street hails, but only in the areas indicated in green on the map (i.e. above W 110 St/E 96th St in Manhattan and in the boroughs).
Records include fields capturing pick-up and drop-off dates/times, pick-up and drop-off locations, trip distances, itemized fares, rate types, payment types, and driver-reported passenger counts.
样例数据展示
s3://serverless-analytics/glue-blog/green/green_tripdata_2016-01.csv
Data dictionary
FHV
FHV data includes trip data from high-volume for-hire vehicle bases (bases for companies dispatching 10,000+ trip per day, meaning Uber, Lyft, Via, and Juno), community livery bases, luxury limousine bases, and black car bases.
The TLC began receiving FHV trip data from bases in 2015, but the amount of information that has been provided has changed over time. In 2015, only the dispatching base number, pickup datetime, and the location of the pickup (see section on matching zone IDs below) were provided to the TLC. In summer of 2017, the TLC mandated that the companies provide the drop-off date/time and the drop-off location. In 2017, the TLC also started to receive information on shared rides, like those offered in services like Lyft Line and Uber Pool. A trip is only considered shared if it was reserved specially with one of these services. See note below for more information on shared rides. After the high volume license type was created in Feb 2019, a high-volume license number was added. This is an overall identifier for app companies who may have multiple base licenses.
样例数据展示
s3://serverless-analytics/glue-blog/fhv/fhv_tripdata_2016-01.csv
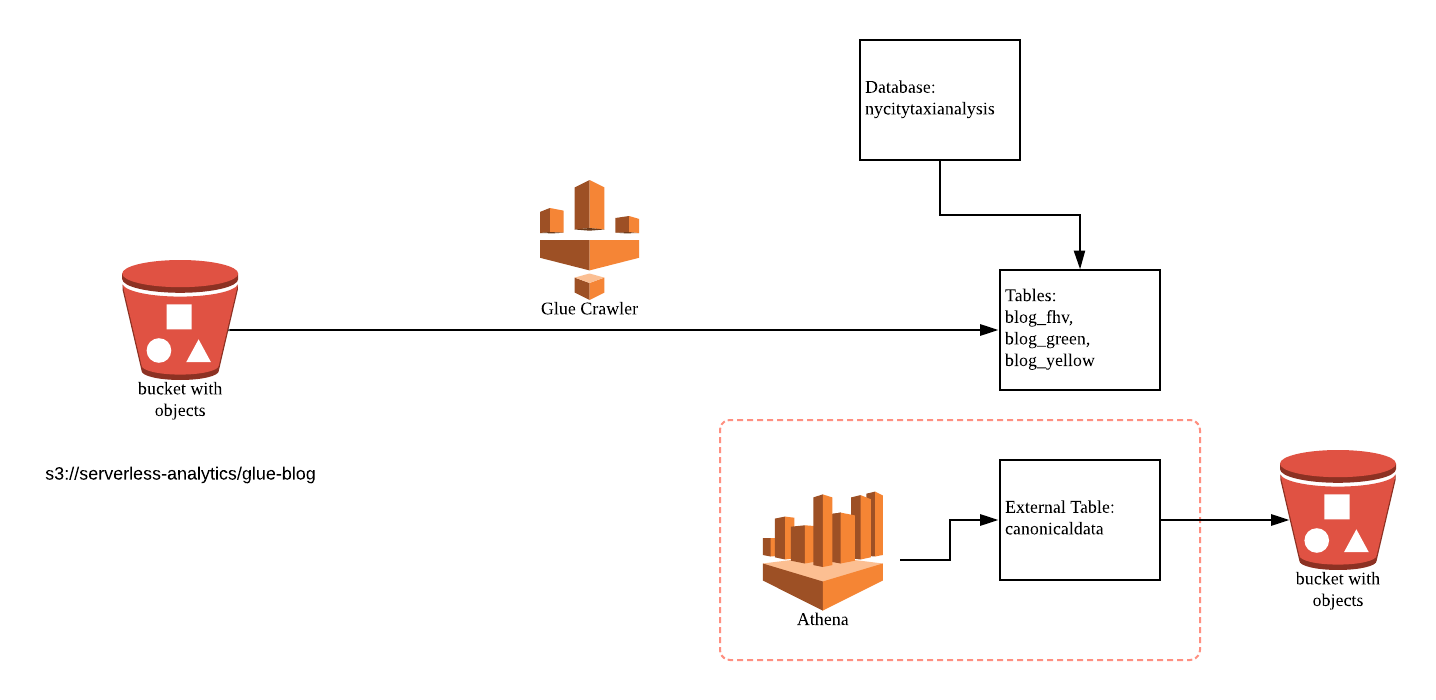
从Glue的blog_fhv、blog_green、blog_yellow到Athena table "canonicaldata"的fields的映射关系(DB: "nycitytaxianalysis")。
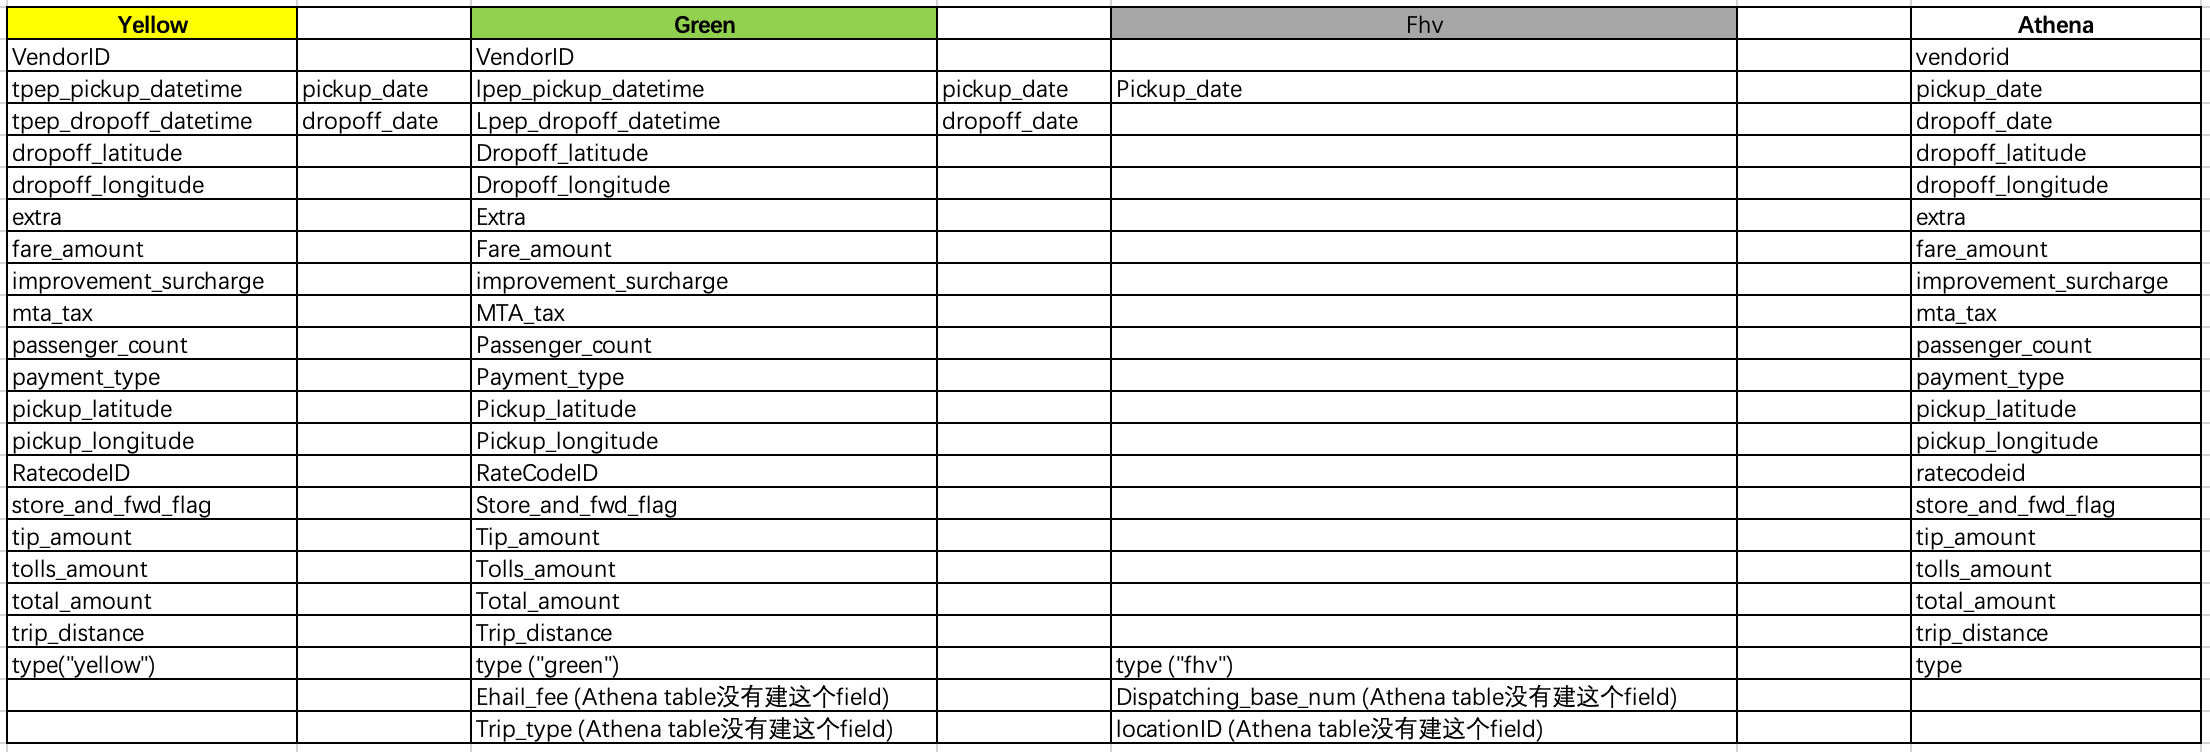
Explain the data
The yellow and green taxi trip records include fields capturing pick-up and drop-off dates/times, pick-up and drop-off locations, trip distances, itemized fares, rate types, payment types, and driver-reported passenger counts. The data used in the attached datasets were collected and provided to the NYC TLC by technology providers authorized under the Taxicab & Livery Passenger Enhancement Programs (TPEP/LPEP). The trip data was not created by the TLC, and TLC makes no representations as to the accuracy of these data.
The FHV trip records include fields capturing the dispatching base license number and the pick-up date, time, and taxi zone location ID (shape file below). These records are generated from the FHV Trip Record submissions made by bases. Note: The TLC publishes base trip record data as submitted by the bases, and we cannot guarantee or confirm their accuracy or completeness. Therefore, this may not represent the total amount of trips dispatched by all TLC-licensed bases. The TLC performs routine reviews of the records and takes enforcement actions when necessary to ensure, to the extent possible, complete and accurate information.
From: TLC Trip Record Data
Data dictionary
Add a Glue database in Glue (in this case, "nycitytaxianalysis").
CLI
$ aws glue create-database --database-input "{\"Name\":\"nycitytaxianalysis\"}"
Add a Glue crawler "NYCityTaxiCrawler" (Crawler name:NYCityTaxiCrawler). It infers the schemas, structure, and other properties of the data.
Run crawler.
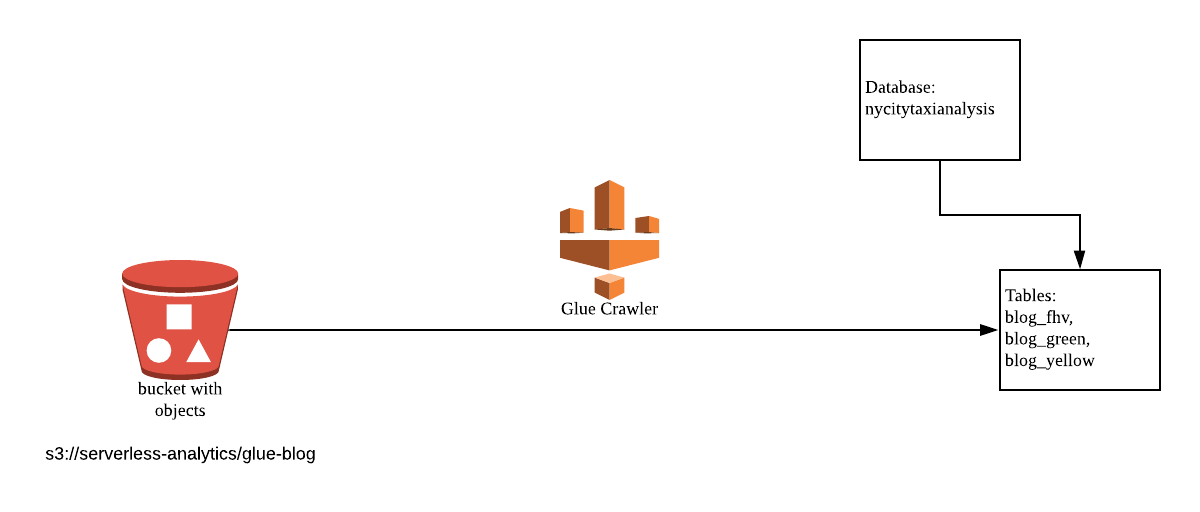
Once crawling is complete, the console will show below message:
The Glue Data Catalog is shared to both Glue and Athena. This means once the database or the table is created in Glue, it will automatically appear in Athena's console. In this case, the tables are created by Glue Crawler.

Postscript
In a previous step setting up "Getting Started Using AWS Glue", we created an IAM role for Glue "AWSGlueServiceRoleDefault". For more information, refer to AWS-Glue-Getting Started Using AWS Glue-1_Setting up IAM Permissions for AWS Glue.
Now there are 3 new tables that were created under the database "nycitytaxianalysis", namely, blog_fhv, blog_green, and blog_yellow.

Looking into the "blog_yellow" table, the yellow dataset for January 2017 has 8.7 million rows (the "recordCount" in the "Table properties" shows there are 8717727 (rows)).
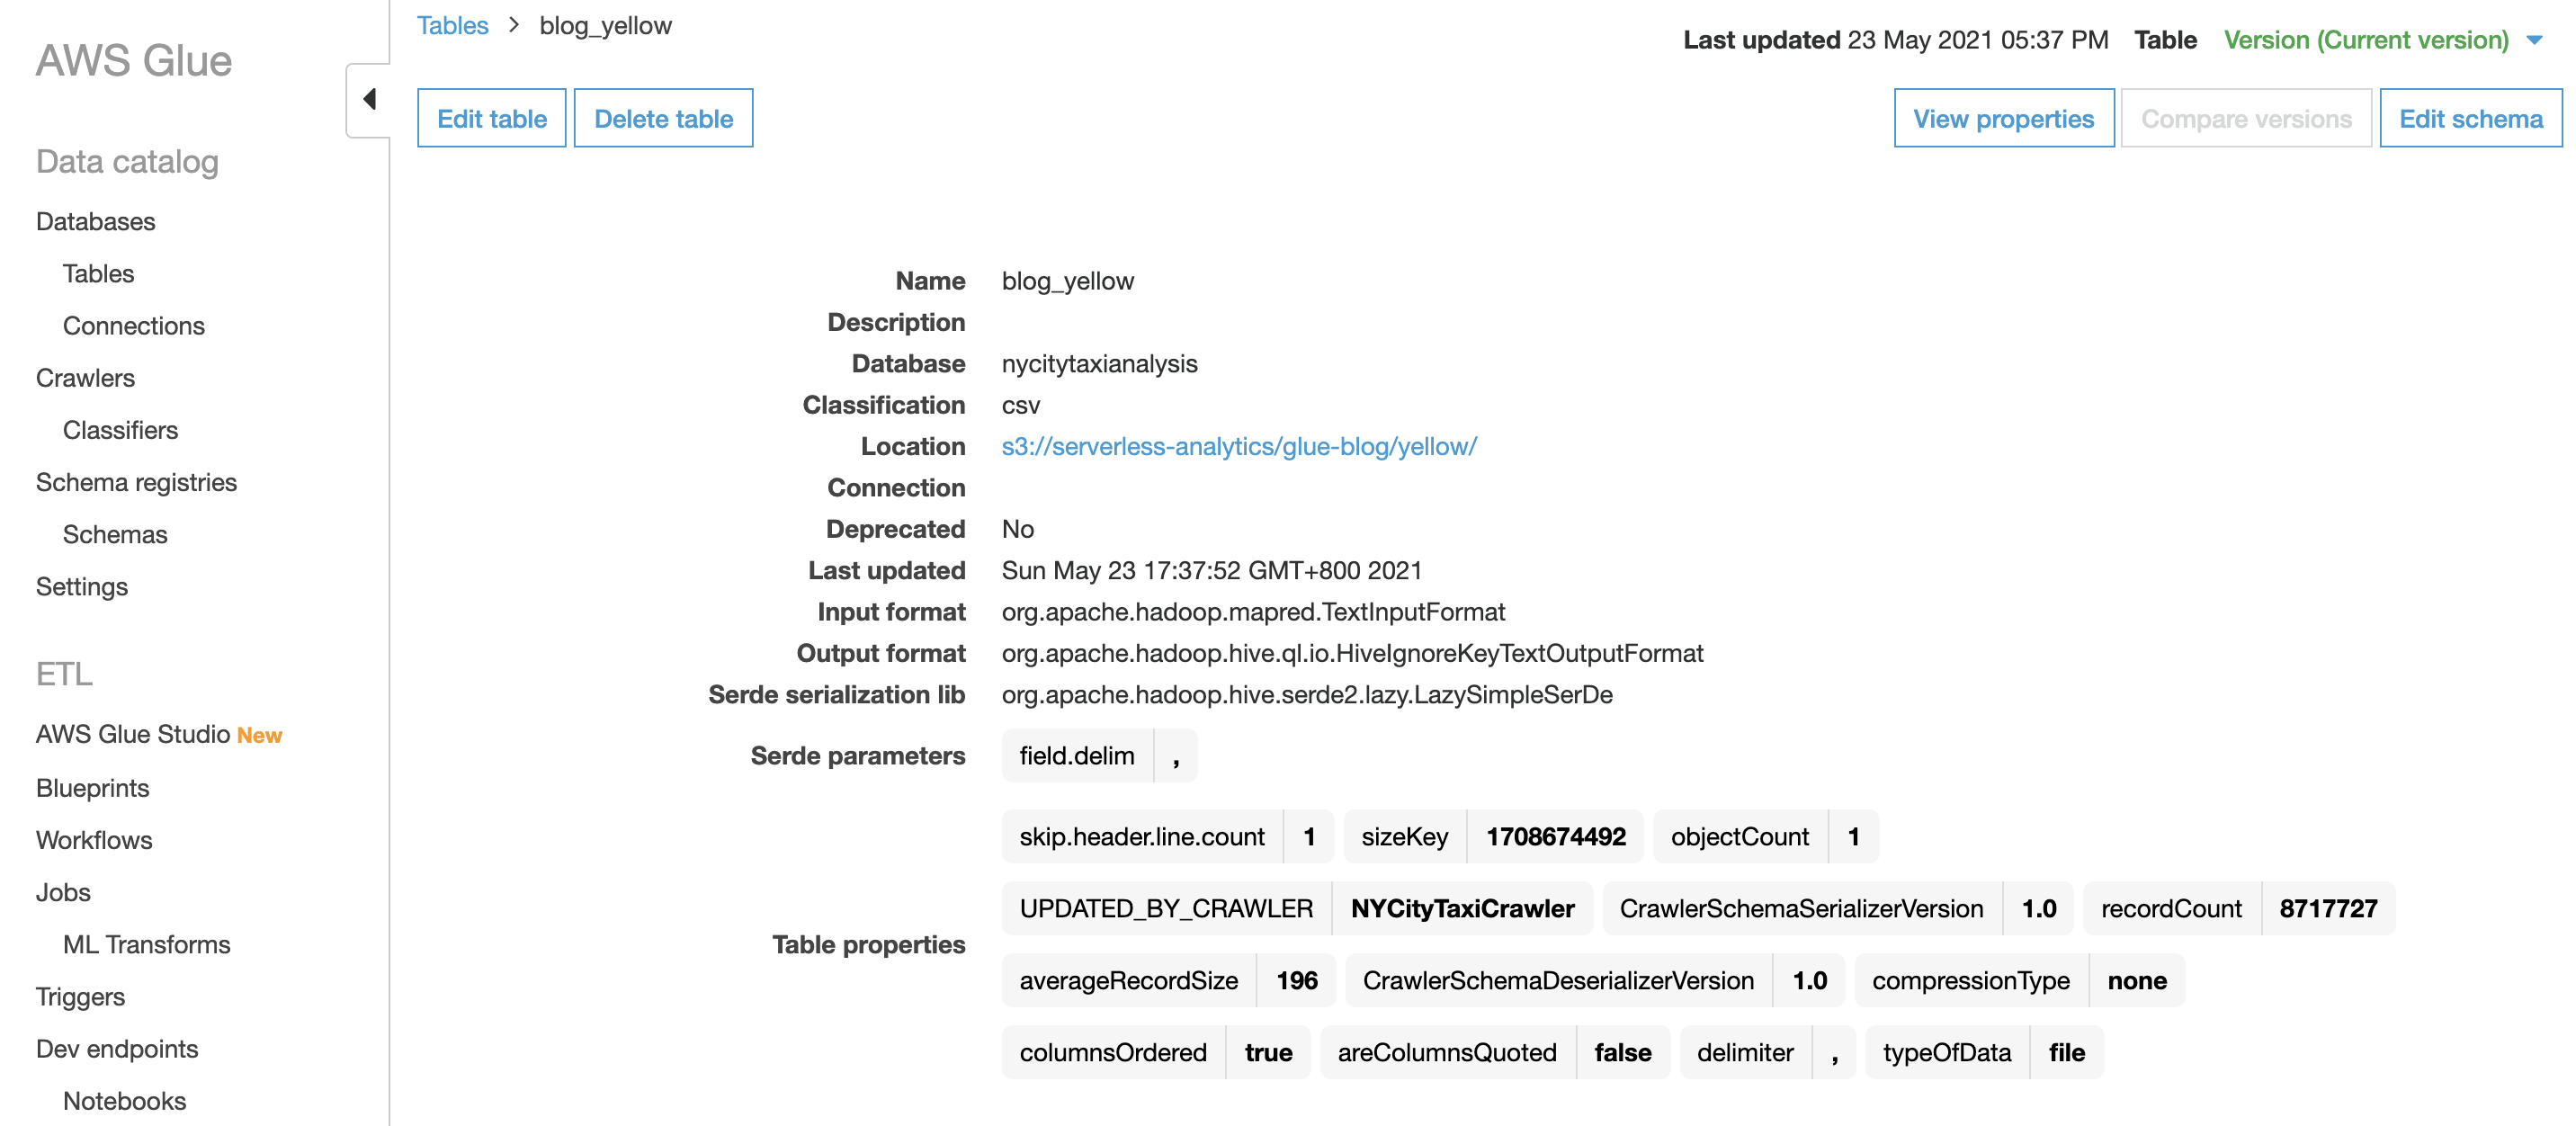
Define ETL Job for Yellow Data
Go to ETL, Jobs
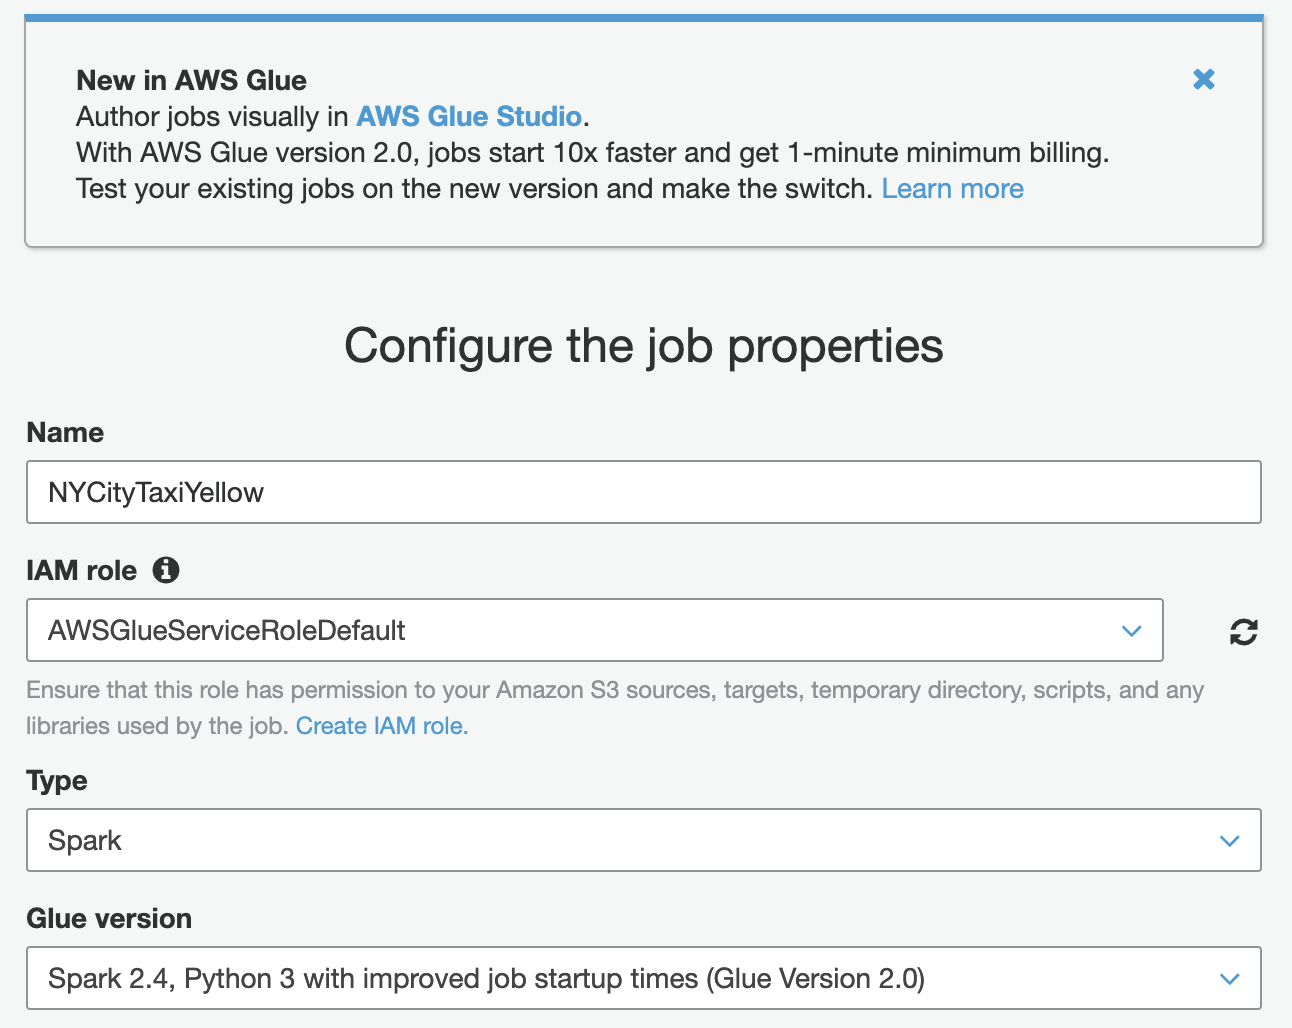
Create a ETL job (in this case, Name: "NYCityTaxiYellow").
IAM role: "AWSGlueServiceRoleDefault".
Nota bene
IAM role should have permissions to write to a new S3 location in a bucket that you own
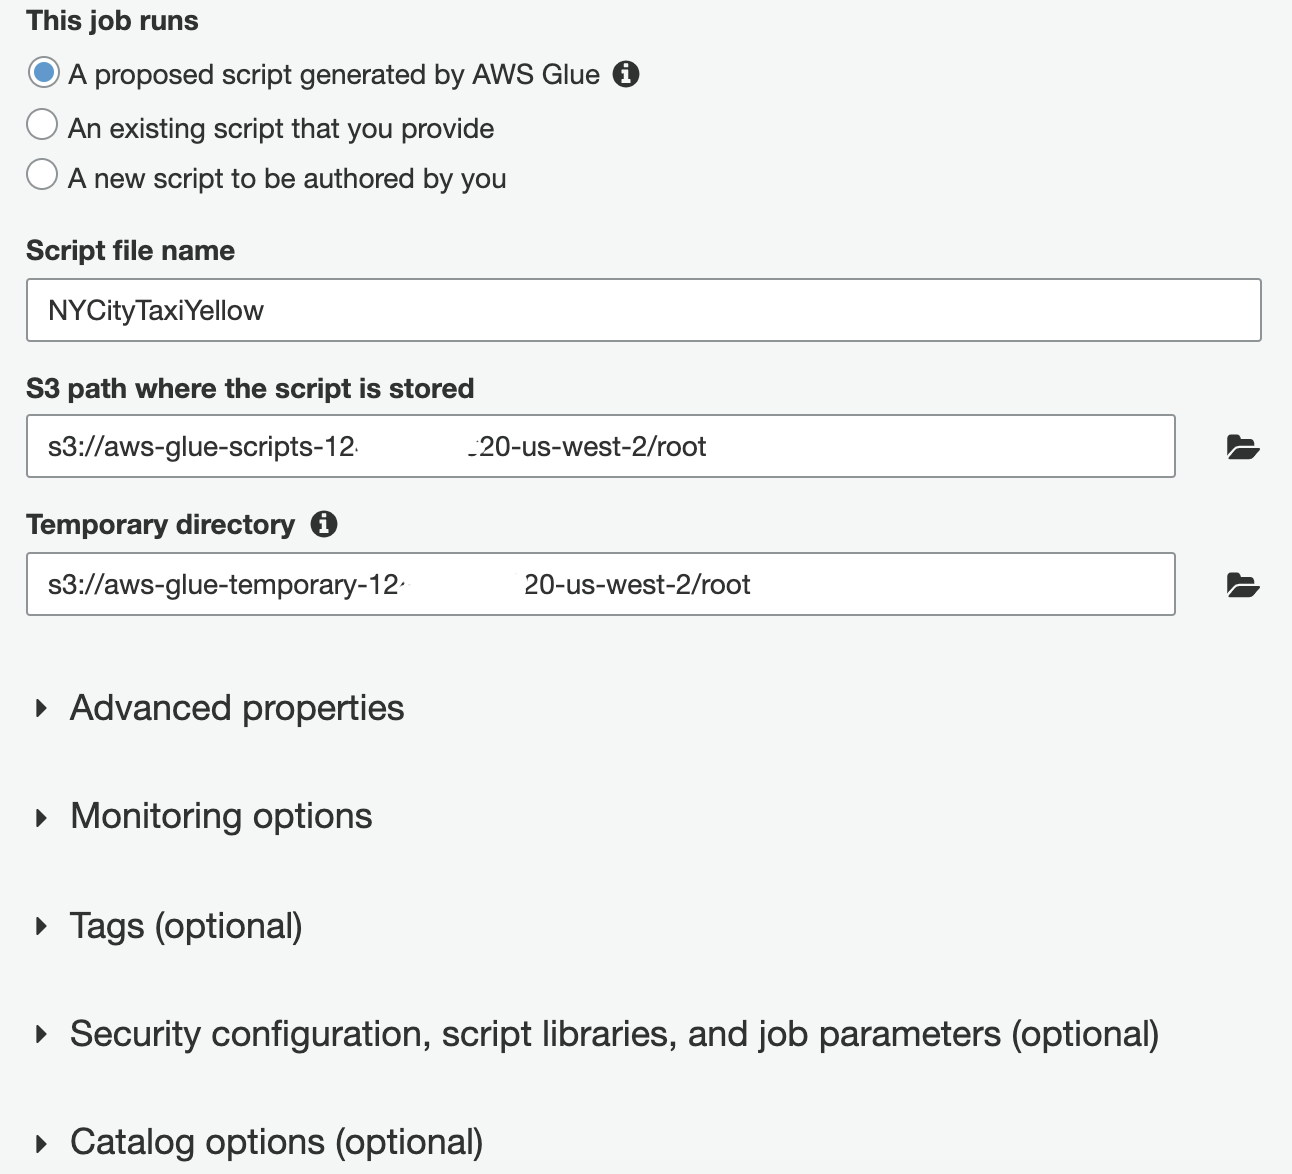
(Optional) Specify a location for the script and tmp space on S3, or use default values.
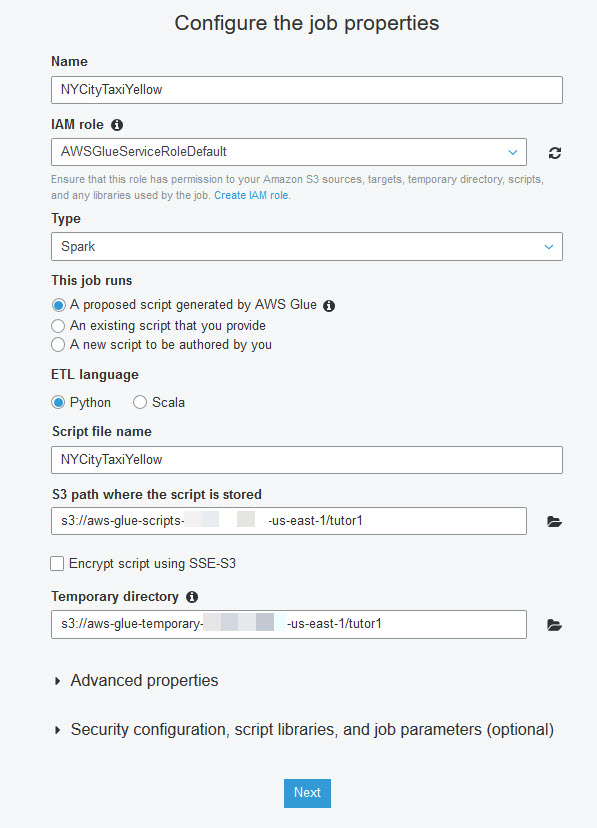 (legacy screenshot)
Choose a data source: "blog_yellow".
Choose a data target: "Create tables in your data target".
Data store: "Amazon S3".
Format: "Parquet".
Target path: "s3://YOUR-S3-BUCKET/glue-blog/" (e.g. YOUR-S3-BUCKET is a value, for example, aws-glue-temporary-<AWS-Account-ID>-us-west-2).
This will generate the file format and location (???) in the later ETL script.
Nota bene
Specify a new location (a new prefix location without any object) to store the results.

In the transform, rename the "tpep_pickup_datetime" and "tpep_dropoff_datetime" to be generic fields. In the raw data (e.g. the corresponding fields in yellow data are called as "tpep_pickup_datetime" and "tpep_dropoff_datetime", refer to the sample data "yellow_tripdata_2016-01.csv" above, and those in green data are called as "lpep_pickup_datetime" and "Lpep_dropoff_datetime", refer to the sample data "green_tripdata_2016-01.csv" above), these fields are listed differently, and you should use a common name. Change the data types to be timestamp rather than strings.

Click the "Save job and edit script" button.
Now Glue creates a script.
Add the following code at the first part.
Find the last call before the the line that start with the datasink.
给来自这个数据源的每一条对应数据条目增加一个field,field的名称为type,每一个条目里这个field对应的值都是yellow。
Insert above code snippet before below code:
In the last datasink call, change the DynamicFrame to point to the new custom DynamicFrame created from the Spark DataFrame.
Change:
Full code:
PS
For how the file format is converted from CSV to Parquet, refer to Format Options for ETL Inputs and Outputs in AWS Glue.
PySpark SQL functions lit() is used to add a new column to DataFrame by assigning a literal or constant value. For more information, refer to PySpark lit() – Add Literal or Constant to DataFrame. And this will add a new column (with the same value "yellow") for each row that handled by this ETL job.
Save.
Run the ETL (Run job).
Go to Athena console (and create a table there for the new data format). This shows how you can interact with the data catalog either through Glue or the Athena.
In the Athena query editor console, make sure the nycitytaxianalysis database is selected. Then, execute below SQL statement in the Athena console. Replace the account ID.
Nota bene
The S3 path ends with "/glue-blog/", corresponding to the script. YOUR-S3-BUCKET looks like aws-glue-temporary-###-us-west-2.
After about 6 minutes, the ETL job will complete. Run below SQL query in Athena.
Define ETL Job for Green Data
In Glue console, create a new ETL job, Here we name it as "NYCityTaxiGreen".
Choose "blog_green" as the source. This time, specify the existing table "canonicaldata" (created by the above step) in the data catalog as the data target. Choose the new pickup_date and dropoff_date fields for the target field types for the date variables, as shown below.
Change the data types to be timestamp rather than strings. The following table outlines the updates.

Click the "Save job and edit script" button.
Insert the following two lines at the end of the top imports:
Type this line before the last sink calls. Replace the <DYNAMIC_FRAME_NAME> with the name generated in the script, in this case it is "resolvechoice4".
给来自这个数据源的每一条对应数据条目增加一个field,field的名称为type,每一个条目里这个field对应的值都是green。
Full code:
Run the same SQL query as the previous one, in Athena.
Define ETL Job for FHV data
You have one more dataset to convert, so create a new ETL job. Name the job "NYCityTaxiFHV".
Choose "blog_fhv" as the source.
Specify the existing table "canonicaldata" in the data catalog as the data target.
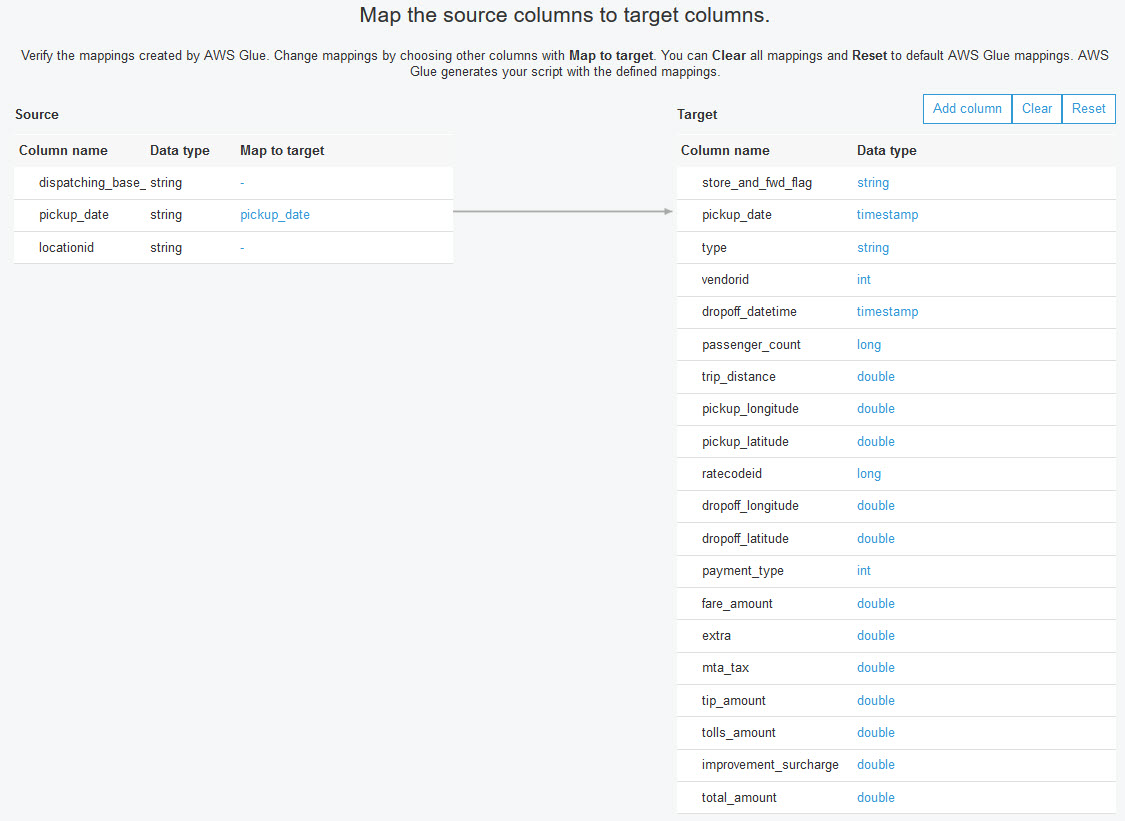
This dataset is limited as it only has 3 fields, one of which you are converting.
Choose "–" (dash) for the dispatcher (dispatching_base_num) and location (locationid), and map the pickup_ date to the canonical field (pickup_date) (currently, nothing changed).
Click the "Save job and edit script" button.
In the script, insert the following two lines at the end of the top imports:
Find the last call before the the line that start with the datasink. This is the DynamicFrame that is being used to write out the data.
Now convert that to a DataFrame. Replace the <DYNAMIC_FRAME_NAME> with the name generated in the script, in this case it is "resolvechoice4".
Insert this code before the last sink call.
And update below code from:
Save and then run job.
After about 4 minutes, the ETL job should complete. Run the same SQL query as the previous one, in Athena.
Run below SQL query in Athena.
Remember the data dict for Yellow and Green. Re-post here:
Run below SQL query in Athena.
Run below SQL query in Athena.
Login QuickSight console for the Oregon region via URL https://us-west-2.quicksight.aws.amazon.com/sn/start.
Create a new dataset for NY taxi data
Create a new Athena data source. (Create a Dataset, FROM NEW DATA SOURCES: Athena)
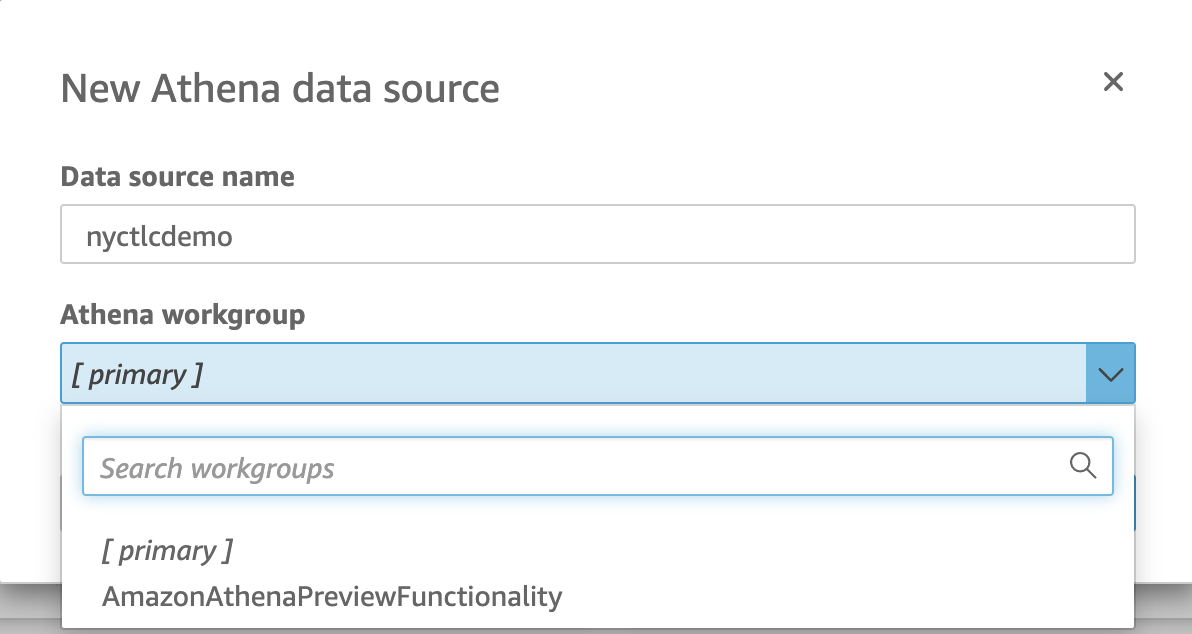
Data source name: nyctlcdemo. For Athena workgroup, select "[primary]".
Point it to the canonical taxi data. (Database: nycitytaxianalysis; Tables: canonicaldata)
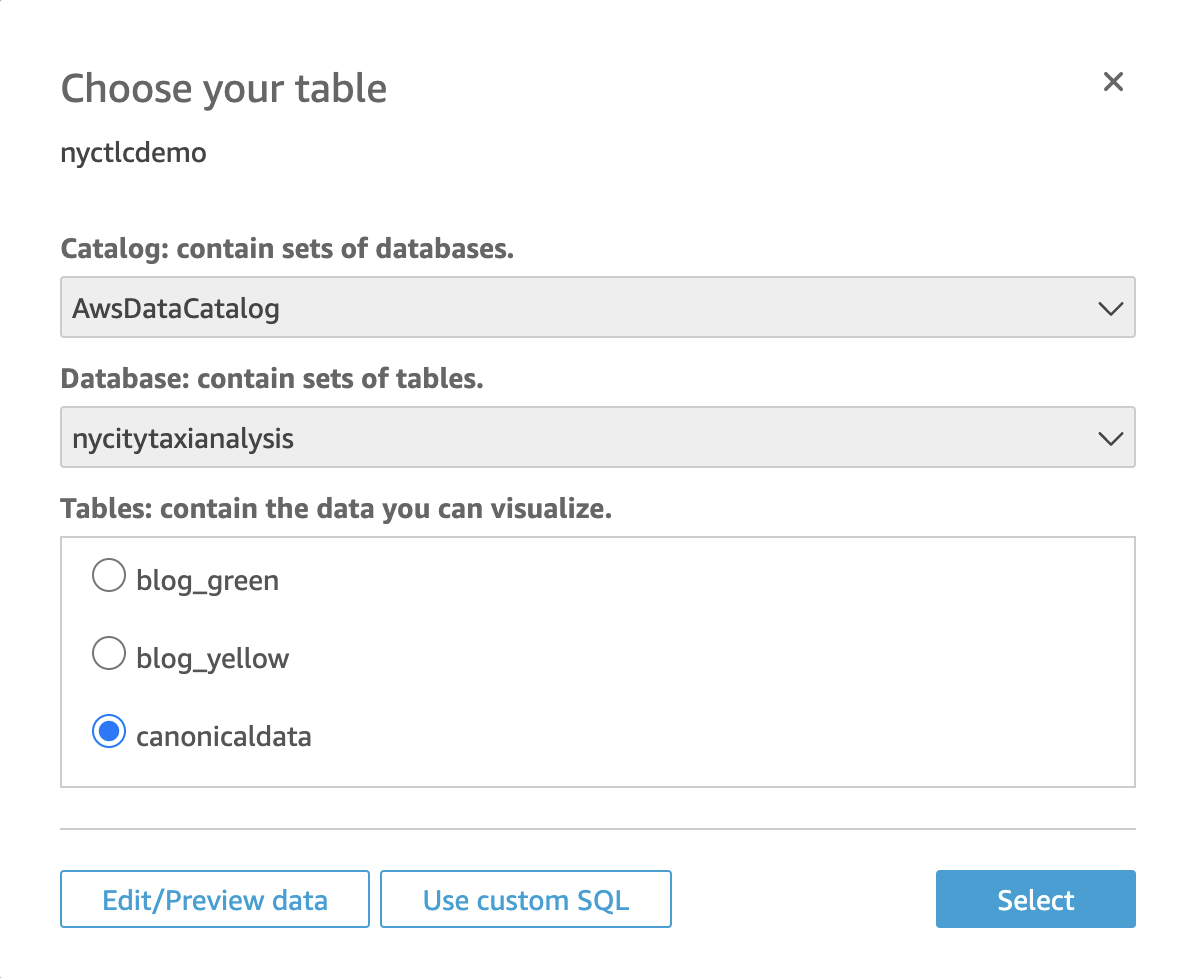
Click Edit/Preview data button.
Add a new calculated field named HourOfDay.
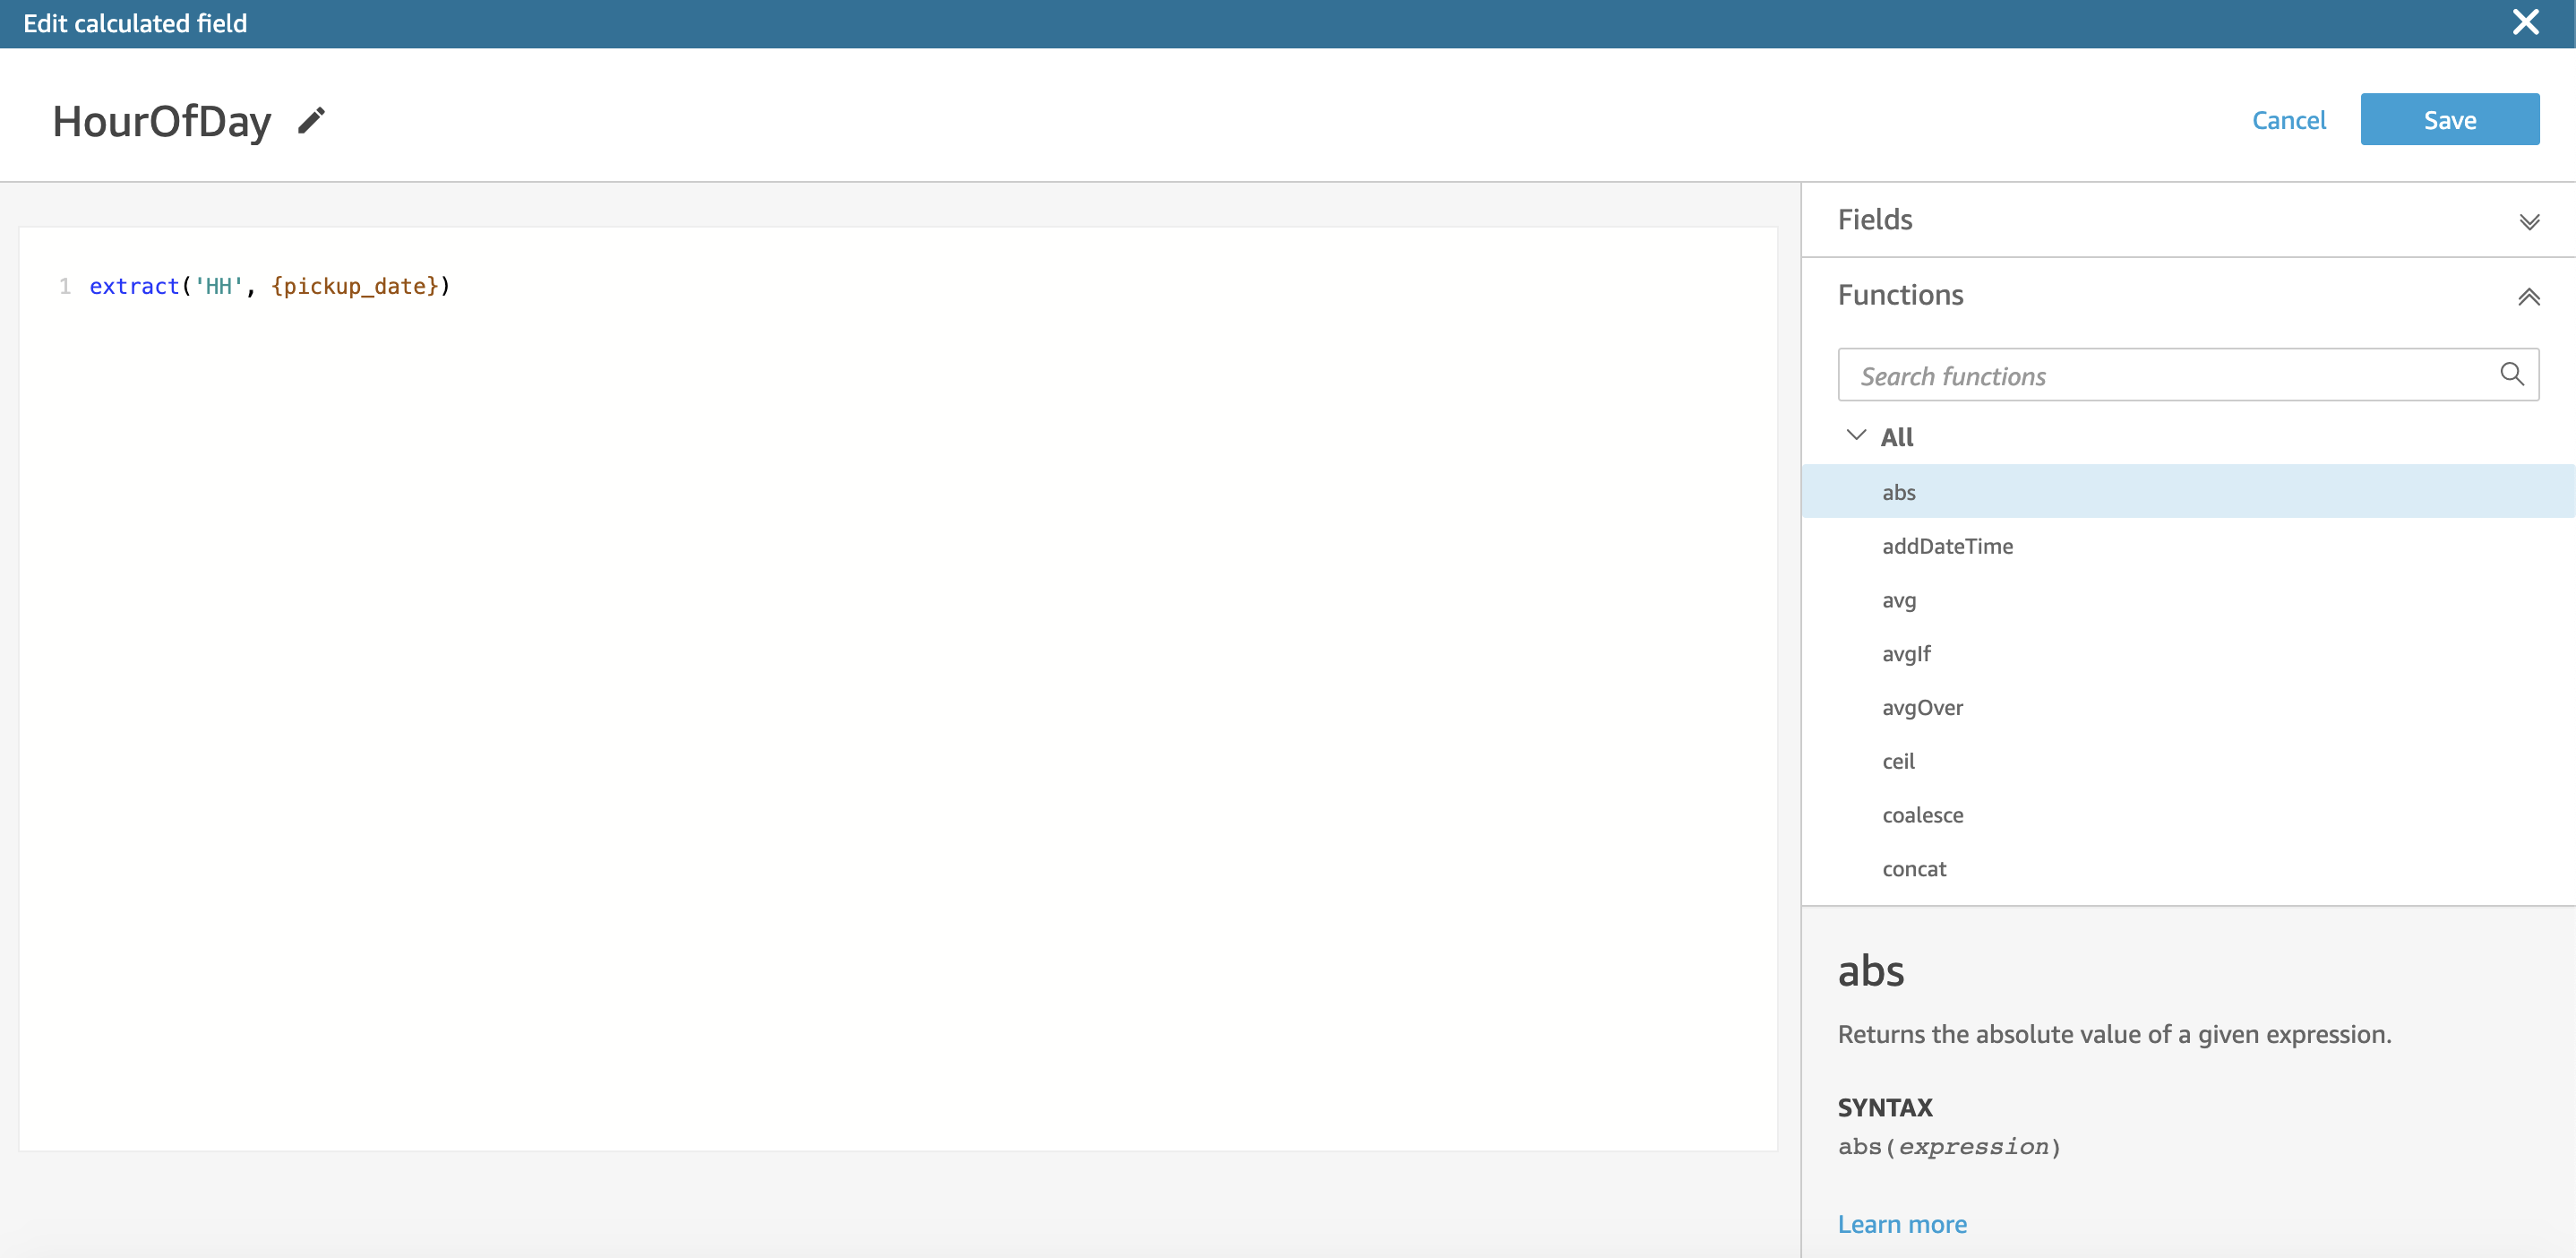
Choose Save and Visualize.
Choose Save & Publish.
Choose Publish & Visualize.
Choose Interactive sheet.
You can now visualize this dataset and query through Athena the canonical dataset on S3 that has been converted by Glue.
Selecting HourOfDay allows you to see how many taxi rides there are based on the hour of the day. This is a calculated field that is being derived by the timestamp in the raw dataset.

You can also deselect that and choose type to see the total counts again by type.

Now choose the pickup_date field in addition to the type field and notice that the plot type automatically changed. Because time is being used, it’s showing a time chart defaulting to the year.
Click "pickup_data" under the "X axis". From "Aggregate", click "Day" to choose a day interval instead.

Expand the x axis to zoom out. You can clearly see a large drop in all rides on January 23, 2016.

From there, you saw that all three datasets were in different formats, but represented the same thing: NY City Taxi rides. You then converted them into a canonical (or normalized) form that is easily queried through Athena and QuickSight, in addition to a wide number of different tools not covered in this post.
Reference
AWS Big Data Blog (Tag: AWS Glue)
New York City Taxi Records dataset
Harmonize, Query, and Visualize Data from Various Providers using AWS Glue, Amazon Athena, and Amazon QuickSight
Build a Data Lake Foundation with AWS Glue and Amazon S3 (This one could be used as a complement of the above one, which is more depth but lack a little bit description.)
TLC Trip Records User Guide
-
缩略语表
| 缩写 | 全称 |
| TLC | Taxi and Limousine Commission |
| yellow | New York City's medallion taxis |
| green | street hail livery taxis |
| FHV | for-hire vehicle |
Data Analytics Services Architecture

Explain Sample Data
In each trip record dataset, one row represents a single trip made by a TLC-licensed vehicle.
Yellow
Trips made by New York City’s iconic yellow taxis have been recorded and provided to the TLC since 2009. Yellow taxis are traditionally hailed by signaling to a driver who is on duty and seeking a passenger (street hail), but now they may also be hailed using an e-hail app like Curb or Arro. Yellow taxis are the only vehicles permitted to respond to a street hail from a passenger in all five boroughs.
Records include fields capturing pick-up and drop-off dates/times, pick-up and drop-off locations, trip distances, itemized fares, rate types, payment types, and driver-reported passenger counts. The records were collected and provided to the NYC TLC by technology service providers. The trip data was not created by the TLC, and TLC cannot guarantee their accuracy.
样例数据展示
s3://serverless-analytics/glue-blog/yellow/yellow_tripdata_2016-01.csv
VendorID,tpep_pickup_datetime,tpep_dropoff_datetime,passenger_count,trip_distance,pickup_longitude,pickup_latitude,RatecodeID,store_and_fwd_flag,dropoff_longitude,dropoff_latitude,payment_type,fare_amount,extra,mta_tax,tip_amount,tolls_amount,improvement_surcharge,total_amount
2,2016-01-01 00:00:00,2016-01-01 00:00:00,2,1.10,-73.990371704101563,40.734695434570313,1,N,-73.981842041015625,40.732406616210937,2,7.5,0.5,0.5,0,0,0.3,8.8
2,2016-01-01 00:00:00,2016-01-01 00:00:00,5,4.90,-73.980781555175781,40.729911804199219,1,N,-73.944473266601563,40.716678619384766,1,18,0.5,0.5,0,0,0.3,19.3
2,2016-01-01 00:00:00,2016-01-01 00:00:00,1,10.54,-73.984550476074219,40.6795654296875,1,N,-73.950271606445313,40.788925170898438,1,33,0.5,0.5,0,0,0.3,34.3
2,2016-01-01 00:00:00,2016-01-01 00:00:00,1,4.75,-73.99346923828125,40.718990325927734,1,N,-73.962242126464844,40.657333374023437,2,16.5,0,0.5,0,0,0.3,17.3
2,2016-01-01 00:00:00,2016-01-01 00:00:00,3,1.76,-73.960624694824219,40.781330108642578,1,N,-73.977264404296875,40.758514404296875,2,8,0,0.5,0,0,0.3,8.8
2,2016-01-01 00:00:00,2016-01-01 00:18:30,2,5.52,-73.980117797851563,40.743049621582031,1,N,-73.913490295410156,40.763141632080078,2,19,0.5,0.5,0,0,0.3,20.3
2,2016-01-01 00:00:00,2016-01-01 00:26:45,2,7.45,-73.994056701660156,40.719989776611328,1,N,-73.966361999511719,40.789871215820313,2,26,0.5,0.5,0,0,0.3,27.3
1,2016-01-01 00:00:01,2016-01-01 00:11:55,1,1.20,-73.979423522949219,40.744613647460938,1,N,-73.992034912109375,40.753944396972656,2,9,0.5,0.5,0,0,0.3,10.3
1,2016-01-01 00:00:02,2016-01-01 00:11:14,1,6.00,-73.947151184082031,40.791046142578125,1,N,-73.920768737792969,40.865577697753906,2,18,0.5,0.5,0,0,0.3,19.3
...
Data dictionary
| Field Name | Description |
| VendorID | A code indicating the TPEP provider that provided the record. 1= Creative Mobile Technologies, LLC; 2= VeriFone Inc. |
| tpep_pickup_datetime | The date and time when the meter was engaged. |
| tpep_dropoff_datetime | The date and time when the meter was disengaged. |
| passenger_count | The number of passengers in the vehicle. This is a driver-entered value. |
| trip_distance | The elapsed trip distance in miles reported by the taximeter. |
| RateCodeID | The final rate code in effect at the end of the trip. 1= Standard rate 2=JFK 3=Newark 4=Nassau or Westchester 5=Negotiated fare 6=Group ride |
| store_and_fwd_flag | This flag indicates whether the trip record was held in vehicle memory before sending to the vendor, aka "store and forward," because the vehicle did not have a connection to the server. Y= store and forward trip N= not a store and forward trip |
| dropoff_longitude | Longitude where the meter was disengaged. |
| dropoff_ latitude | Latitude where the meter was disengaged. |
| payment_type | A numeric code signifying how the passenger paid for the trip. 1= Credit card 2= Cash 3= No charge 4= Dispute 5= Unknown 6= Voided trip |
| fare_amount | The time-and-distance fare calculated by the meter. |
| extra | Miscellaneous extras and surcharges. Currently, this only includes the $0.50 and $1 rush hour and overnight charges. |
| mta_tax | $0.50 MTA tax that is automatically triggered based on the metered rate in use. |
| improvement_surcharge | $0.30 improvement surcharge assessed trips at the flag drop. The improvement surcharge began being levied in 2015. |
| tip_amount | Tip amount – This field is automatically populated for credit card tips. Cash tips are not included. |
| tolls_amount | Total amount of all tolls paid in trip. |
| total_amount | The total amount charged to passengers. Does not include cash tips. |
Green
Green taxis, also known as boro taxis and street-hail liveries, were introduced in August of 2013 to improve taxi service and availability in the boroughs. Green taxis may respond to street hails, but only in the areas indicated in green on the map (i.e. above W 110 St/E 96th St in Manhattan and in the boroughs).
Records include fields capturing pick-up and drop-off dates/times, pick-up and drop-off locations, trip distances, itemized fares, rate types, payment types, and driver-reported passenger counts.
样例数据展示
s3://serverless-analytics/glue-blog/green/green_tripdata_2016-01.csv
VendorID,lpep_pickup_datetime,Lpep_dropoff_datetime,Store_and_fwd_flag,RateCodeID,Pickup_longitude,Pickup_latitude,Dropoff_longitude,Dropoff_latitude,Passenger_count,Trip_distance,Fare_amount,Extra,MTA_tax,Tip_amount,Tolls_amount,Ehail_fee,improvement_surcharge,Total_amount,Payment_type,Trip_type
2,2016-01-01 00:29:24,2016-01-01 00:39:36,N,1,-73.928642272949219,40.680610656738281,-73.924278259277344,40.698043823242188,1,1.46,8,0.5,0.5,1.86,0,,0.3,11.16,1,1
2,2016-01-01 00:19:39,2016-01-01 00:39:18,N,1,-73.952674865722656,40.723175048828125,-73.923919677734375,40.761379241943359,1,3.56,15.5,0.5,0.5,0,0,,0.3,16.8,2,1
2,2016-01-01 00:19:33,2016-01-01 00:39:48,N,1,-73.971611022949219,40.676105499267578,-74.013160705566406,40.646072387695313,1,3.79,16.5,0.5,0.5,4.45,0,,0.3,22.25,1,1
2,2016-01-01 00:22:12,2016-01-01 00:38:32,N,1,-73.989501953125,40.669578552246094,-74.000648498535156,40.689033508300781,1,3.01,13.5,0.5,0.5,0,0,,0.3,14.8,2,1
2,2016-01-01 00:24:01,2016-01-01 00:39:22,N,1,-73.964729309082031,40.682853698730469,-73.940719604492188,40.663013458251953,1,2.55,12,0.5,0.5,0,0,,0.3,13.3,2,1
2,2016-01-01 00:32:59,2016-01-01 00:39:35,N,1,-73.891143798828125,40.746456146240234,-73.867744445800781,40.742111206054688,1,1.37,7,0.5,0.5,0,0,,0.3,8.3,2,1
2,2016-01-01 00:34:42,2016-01-01 00:39:21,N,1,-73.896675109863281,40.746196746826172,-73.886192321777344,40.745689392089844,1,.57,5,0.5,0.5,0,0,,0.3,6.3,2,1
2,2016-01-01 00:31:23,2016-01-01 00:39:36,N,1,-73.953353881835937,40.803558349609375,-73.949150085449219,40.794120788574219,1,1.01,7,0.5,0.5,0,0,,0.3,8.3,2,1
...
Data dictionary
| Field Name | Description |
| VendorID | A code indicating the LPEP provider that provided the record. 1= Creative Mobile Technologies, LLC; 2= VeriFone Inc. |
| lpep_pickup_datetime | The date and time when the meter was engaged. |
| lpep_dropoff_datetime | The date and time when the meter was disengaged. |
| Passenger_count | The number of passengers in the vehicle. This is a driver-entered value. |
| Trip_distance | The elapsed trip distance in miles reported by the taximeter. |
| Pickup_longitude | Longitude where the meter was engaged. |
| Pickup_latitude | Latitude where the meter was engaged. |
| RateCodeID | The final rate code in effect at the end of the trip. 1= Standard rate 2=JFK 3=Newark 4=Nassau or Westchester 5=Negotiated fare 6=Group ride |
| Store_and_fwd_flag | This flag indicates whether the trip record was held in vehicle memory before sending to the vendor, aka “store and forward,” because the vehicle did not have a connection to the server. Y= store and forward trip N= not a store and forward trip |
| Dropoff_longitude | Longitude where the meter was timed off. |
| Dropoff_ latitude | Latitude where the meter was timed off |
| Payment_type | A numeric code signifying how the passenger paid for the trip. 1= Credit card 2= Cash 3= No charge 4= Dispute 5= Unknown 6= Voided trip |
| Fare_amount | The time-and-distance fare calculated by the meter. |
| Extra | Miscellaneous extras and surcharges. Currently, this only includes the $0.50 and $1 rush hour and overnight charges. |
| MTA_tax | $0.50 MTA tax that is automatically triggered based on the metered rate in use. |
| improvement_surcharge | $0.30 improvement surcharge assessed on hailed trips at the flag drop. The improvement surcharge began being levied in 2015. |
| Tip_amount | Tip amount – This field is automatically populated for credit card tips. Cash tips are not included. |
| Tolls_amount | Total amount of all tolls paid in trip. |
| Total_amount | The total amount charged to passengers. Does not include cash tips. |
| Trip_type | A code indicating whether the trip was a street-hail or a dispatch that is automatically assigned based on the metered rate in use but can be altered by the driver. 1= Street-hail 2= Dispatch |
FHV
FHV data includes trip data from high-volume for-hire vehicle bases (bases for companies dispatching 10,000+ trip per day, meaning Uber, Lyft, Via, and Juno), community livery bases, luxury limousine bases, and black car bases.
The TLC began receiving FHV trip data from bases in 2015, but the amount of information that has been provided has changed over time. In 2015, only the dispatching base number, pickup datetime, and the location of the pickup (see section on matching zone IDs below) were provided to the TLC. In summer of 2017, the TLC mandated that the companies provide the drop-off date/time and the drop-off location. In 2017, the TLC also started to receive information on shared rides, like those offered in services like Lyft Line and Uber Pool. A trip is only considered shared if it was reserved specially with one of these services. See note below for more information on shared rides. After the high volume license type was created in Feb 2019, a high-volume license number was added. This is an overall identifier for app companies who may have multiple base licenses.
样例数据展示
s3://serverless-analytics/glue-blog/fhv/fhv_tripdata_2016-01.csv
Dispatching_base_num,Pickup_date,locationID
B00001,2016-01-01 00:30:00,
B00001,2016-01-01 00:30:00,
B00001,2016-01-01 02:30:00,
B00001,2016-01-01 07:00:00,
B00001,2016-01-01 08:45:00,
B00001,2016-01-01 09:00:00,
...
从Glue的blog_fhv、blog_green、blog_yellow到Athena table "canonicaldata"的fields的映射关系(DB: "nycitytaxianalysis")。
| Yellow | Green | Fhv | Athena | |||
| VendorID | VendorID | vendorid | ||||
| tpep_pickup_datetime | pickup_date | lpep_pickup_datetime | pickup_date | Pickup_date | pickup_date | |
| tpep_dropoff_datetime | dropoff_date | Lpep_dropoff_datetime | dropoff_date | dropoff_date | ||
| dropoff_latitude | Dropoff_latitude | dropoff_latitude | ||||
| dropoff_longitude | Dropoff_longitude | dropoff_longitude | ||||
| extra | Extra | extra | ||||
| fare_amount | Fare_amount | fare_amount | ||||
| improvement_surcharge | improvement_surcharge | improvement_surcharge | ||||
| mta_tax | MTA_tax | mta_tax | ||||
| passenger_count | Passenger_count | passenger_count | ||||
| payment_type | Payment_type | payment_type | ||||
| pickup_latitude | Pickup_latitude | pickup_latitude | ||||
| pickup_longitude | Pickup_longitude | pickup_longitude | ||||
| RatecodeID | RateCodeID | ratecodeid | ||||
| store_and_fwd_flag | Store_and_fwd_flag | store_and_fwd_flag | ||||
| tip_amount | Tip_amount | tip_amount | ||||
| tolls_amount | Tolls_amount | tolls_amount | ||||
| total_amount | Total_amount | total_amount | ||||
| trip_distance | Trip_distance | trip_distance | ||||
| type("yellow") | type ("green") | type ("fhv") | type | |||
| Ehail_fee (Athena table没有建这个field) | Dispatching_base_num (Athena table没有建这个field) | |||||
| Trip_type (Athena table没有建这个field) | locationID (Athena table没有建这个field) |

Explain the data
The yellow and green taxi trip records include fields capturing pick-up and drop-off dates/times, pick-up and drop-off locations, trip distances, itemized fares, rate types, payment types, and driver-reported passenger counts. The data used in the attached datasets were collected and provided to the NYC TLC by technology providers authorized under the Taxicab & Livery Passenger Enhancement Programs (TPEP/LPEP). The trip data was not created by the TLC, and TLC makes no representations as to the accuracy of these data.
The FHV trip records include fields capturing the dispatching base license number and the pick-up date, time, and taxi zone location ID (shape file below). These records are generated from the FHV Trip Record submissions made by bases. Note: The TLC publishes base trip record data as submitted by the bases, and we cannot guarantee or confirm their accuracy or completeness. Therefore, this may not represent the total amount of trips dispatched by all TLC-licensed bases. The TLC performs routine reviews of the records and takes enforcement actions when necessary to ensure, to the extent possible, complete and accurate information.
From: TLC Trip Record Data
Data dictionary
| Field Name | Description |
| Dispatching_base_num | The TLC Base License Number of the base that dispatched the trip |
| Pickup_datetime | The date and time of the trip pick-up |
Discover the data
Add a Glue database in Glue (in this case, "nycitytaxianalysis").
CLI
$ aws glue create-database --database-input "{\"Name\":\"nycitytaxianalysis\"}"
Add a Glue crawler "NYCityTaxiCrawler" (Crawler name:NYCityTaxiCrawler). It infers the schemas, structure, and other properties of the data.
- Data store, choose "S3" (Choose a data store: S3).
- Crawl data in: "Specified path in another account".
- Include path: "s3://serverless-analytics/glue-blog".
- Add another data store: "No".
- Choose "Choose an existing IAM role", then choose "AWSGlueServiceRoleDefault".
- Database: select the database created earlier (in this case, it is "nycitytaxianalysis").
- Frequency: "On demand".
- Prefix added to tables / Table name prefix - optional: "blog_".
- Finish.
Run crawler.

Once crawling is complete, the console will show below message:
Crawler "NYCityTaxiCrawler" completed and made the following changes: 3 tables created, 0 tables updated. See the tables created in database nycitytaxianalysis.
The Glue Data Catalog is shared to both Glue and Athena. This means once the database or the table is created in Glue, it will automatically appear in Athena's console. In this case, the tables are created by Glue Crawler.
Postscript
In a previous step setting up "Getting Started Using AWS Glue", we created an IAM role for Glue "AWSGlueServiceRoleDefault". For more information, refer to AWS-Glue-Getting Started Using AWS Glue-1_Setting up IAM Permissions for AWS Glue.
Now there are 3 new tables that were created under the database "nycitytaxianalysis", namely, blog_fhv, blog_green, and blog_yellow.

Looking into the "blog_yellow" table, the yellow dataset for January 2017 has 8.7 million rows (the "recordCount" in the "Table properties" shows there are 8717727 (rows)).

Optimize queries and get data into a canonical form
Define ETL Job for Yellow Data
Go to ETL, Jobs
Create a ETL job (in this case, Name: "NYCityTaxiYellow").
IAM role: "AWSGlueServiceRoleDefault".
Nota bene
IAM role should have permissions to write to a new S3 location in a bucket that you own
(Optional) Specify a location for the script and tmp space on S3, or use default values.
 (legacy screenshot)

Choose a data source: "blog_yellow".
Choose a data target: "Create tables in your data target".
Data store: "Amazon S3".
Format: "Parquet".
Target path: "s3://YOUR-S3-BUCKET/glue-blog/" (e.g. YOUR-S3-BUCKET is a value, for example, aws-glue-temporary-<AWS-Account-ID>-us-west-2).
This will generate the file format and location (???) in the later ETL script.
Nota bene
Specify a new location (a new prefix location without any object) to store the results.
In the transform, rename the "tpep_pickup_datetime" and "tpep_dropoff_datetime" to be generic fields. In the raw data (e.g. the corresponding fields in yellow data are called as "tpep_pickup_datetime" and "tpep_dropoff_datetime", refer to the sample data "yellow_tripdata_2016-01.csv" above, and those in green data are called as "lpep_pickup_datetime" and "Lpep_dropoff_datetime", refer to the sample data "green_tripdata_2016-01.csv" above), these fields are listed differently, and you should use a common name. Change the data types to be timestamp rather than strings.
| Old Name | Target Name | Target Data Type |
| tpep_pickup_datetime | pickup_date | timestamp |
| tpep_dropoff_datetime | dropoff_date | timestamp |

Click the "Save job and edit script" button.
Now Glue creates a script.
Add the following code at the first part.
from pyspark.sql.functions import lit
from awsglue.dynamicframe import DynamicFrame
Find the last call before the the line that start with the datasink.
## @type: DataSink
## @args: [connection_type = "s3", connection_options = {"path": "s3://aws-glue-temporary-123456789012-us-west-2/glue-blog/"}, format = "parquet", transformation_ctx = "datasink4"]
## @return: datasink4
## @inputs: [frame = dropnullfields3]
datasink4 = glueContext.write_dynamic_frame.from_options(frame = dropnullfields3, connection_type = "s3", connection_options = {"path": "s3://aws-glue-temporary-###-us-west-2/glue-blog/"}, format = "parquet", transformation_ctx = "datasink4")
This is the DynamicFrame that is being used to write out the data. Convert that into a DataFrame.给来自这个数据源的每一条对应数据条目增加一个field,field的名称为type,每一个条目里这个field对应的值都是yellow。
##----------------------------------
#convert to a Spark DataFrame...
customDF = dropnullfields3.toDF()

#add a new column for "type"
customDF = customDF.withColumn("type", lit('yellow'))

# Convert back to a DynamicFrame for further processing.
customDynamicFrame = DynamicFrame.fromDF(customDF, glueContext, "customDF_df")
##----------------------------------
Insert above code snippet before below code:
## @type: DataSink
## @args: [connection_type = "s3", connection_options = {"path": "s3://aws-glue-temporary-123456789012-us-west-2/glue-blog/"}, format = "parquet", transformation_ctx = "datasink4"]
## @return: datasink4
## @inputs: [frame = dropnullfields3]
datasink4 = glueContext.write_dynamic_frame.from_options(frame = dropnullfields3, connection_type = "s3", connection_options = {"path": "s3://aws-glue-temporary-###-us-west-2/glue-blog/"}, format = "parquet", transformation_ctx = "datasink4")
In the last datasink call, change the DynamicFrame to point to the new custom DynamicFrame created from the Spark DataFrame.
Change:
datasink4 = glueContext.write_dynamic_frame.from_options(frame = dropnullfields3, connection_type = "s3", connection_options = {"path": "s3://aws-glue-temporary-###-us-west-2/glue-blog/"}, format = "parquet", transformation_ctx = "datasink4")
To:datasink4 = glueContext.write_dynamic_frame.from_options(frame = customDynamicFrame, connection_type = "s3", connection_options = {"path": "s3://aws-glue-temporary-###-us-west-2/glue-blog/"}, format = "parquet", transformation_ctx = "datasink4")
Full code:
import sys
from awsglue.transforms import *
from awsglue.utils import getResolvedOptions
from pyspark.context import SparkContext
from awsglue.context import GlueContext
from awsglue.job import Job
from pyspark.sql.functions import lit
from awsglue.dynamicframe import DynamicFrame

## @params: [JOB_NAME]
args = getResolvedOptions(sys.argv, ['JOB_NAME'])

sc = SparkContext()
glueContext = GlueContext(sc)
spark = glueContext.spark_session
job = Job(glueContext)
job.init(args['JOB_NAME'], args)
## @type: DataSource
## @args: [database = "nycitytaxianalysis", table_name = "blog_yellow", transformation_ctx = "datasource0"]
## @return: datasource0
## @inputs: []
datasource0 = glueContext.create_dynamic_frame.from_catalog(database = "nycitytaxianalysis", table_name = "blog_yellow", transformation_ctx = "datasource0")
## @type: ApplyMapping
## @args: [mapping = [("vendorid", "long", "vendorid", "long"), ("tpep_pickup_datetime", "string", "pickup_date", "timestamp"), ("tpep_dropoff_datetime", "string", "dropoff_date", "timestamp"), ("passenger_count", "long", "passenger_count", "long"), ("trip_distance", "double", "trip_distance", "double"), ("pickup_longitude", "double", "pickup_longitude", "double"), ("pickup_latitude", "double", "pickup_latitude", "double"), ("ratecodeid", "long", "ratecodeid", "long"), ("store_and_fwd_flag", "string", "store_and_fwd_flag", "string"), ("dropoff_longitude", "double", "dropoff_longitude", "double"), ("dropoff_latitude", "double", "dropoff_latitude", "double"), ("payment_type", "long", "payment_type", "long"), ("fare_amount", "double", "fare_amount", "double"), ("extra", "double", "extra", "double"), ("mta_tax", "double", "mta_tax", "double"), ("tip_amount", "double", "tip_amount", "double"), ("tolls_amount", "double", "tolls_amount", "double"), ("improvement_surcharge", "double", "improvement_surcharge", "double"), ("total_amount", "double", "total_amount", "double")], transformation_ctx = "applymapping1"]
## @return: applymapping1
## @inputs: [frame = datasource0]
applymapping1 = ApplyMapping.apply(frame = datasource0, mappings = [("vendorid", "long", "vendorid", "long"), ("tpep_pickup_datetime", "string", "pickup_date", "timestamp"), ("tpep_dropoff_datetime", "string", "dropoff_date", "timestamp"), ("passenger_count", "long", "passenger_count", "long"), ("trip_distance", "double", "trip_distance", "double"), ("pickup_longitude", "double", "pickup_longitude", "double"), ("pickup_latitude", "double", "pickup_latitude", "double"), ("ratecodeid", "long", "ratecodeid", "long"), ("store_and_fwd_flag", "string", "store_and_fwd_flag", "string"), ("dropoff_longitude", "double", "dropoff_longitude", "double"), ("dropoff_latitude", "double", "dropoff_latitude", "double"), ("payment_type", "long", "payment_type", "long"), ("fare_amount", "double", "fare_amount", "double"), ("extra", "double", "extra", "double"), ("mta_tax", "double", "mta_tax", "double"), ("tip_amount", "double", "tip_amount", "double"), ("tolls_amount", "double", "tolls_amount", "double"), ("improvement_surcharge", "double", "improvement_surcharge", "double"), ("total_amount", "double", "total_amount", "double")], transformation_ctx = "applymapping1")
## @type: ResolveChoice
## @args: [choice = "make_struct", transformation_ctx = "resolvechoice2"]
## @return: resolvechoice2
## @inputs: [frame = applymapping1]
resolvechoice2 = ResolveChoice.apply(frame = applymapping1, choice = "make_struct", transformation_ctx = "resolvechoice2")
## @type: DropNullFields
## @args: [transformation_ctx = "dropnullfields3"]
## @return: dropnullfields3
## @inputs: [frame = resolvechoice2]
dropnullfields3 = DropNullFields.apply(frame = resolvechoice2, transformation_ctx = "dropnullfields3")

##----------------------------------
#convert to a Spark DataFrame...
customDF = dropnullfields3.toDF()

#add a new column for "type"
customDF = customDF.withColumn("type", lit('yellow'))

# Convert back to a DynamicFrame for further processing.
customDynamicFrame = DynamicFrame.fromDF(customDF, glueContext, "customDF_df")
##----------------------------------

## @type: DataSink
## @args: [connection_type = "s3", connection_options = {"path": "s3://aws-glue-temporary-123456789012-us-west-2/glue-blog/"}, format = "parquet", transformation_ctx = "datasink4"]
## @return: datasink4
## @inputs: [frame = dropnullfields3]
datasink4 = glueContext.write_dynamic_frame.from_options(frame = customDynamicFrame, connection_type = "s3", connection_options = {"path": "s3://aws-glue-temporary-123456789012-us-west-2/glue-blog/"}, format = "parquet", transformation_ctx = "datasink4")
job.commit()
PS
For how the file format is converted from CSV to Parquet, refer to Format Options for ETL Inputs and Outputs in AWS Glue.
PySpark SQL functions lit() is used to add a new column to DataFrame by assigning a literal or constant value. For more information, refer to PySpark lit() – Add Literal or Constant to DataFrame. And this will add a new column (with the same value "yellow") for each row that handled by this ETL job.
Save.
Run the ETL (Run job).
Go to Athena console (and create a table there for the new data format). This shows how you can interact with the data catalog either through Glue or the Athena.
In the Athena query editor console, make sure the nycitytaxianalysis database is selected. Then, execute below SQL statement in the Athena console. Replace the account ID.
CREATE EXTERNAL TABLE IF NOT EXISTS nycitytaxianalysis.CanonicalData (
         VendorID INT,
         pickup_date TIMESTAMP,
         dropoff_date TIMESTAMP,
         passenger_count BIGINT,
         trip_distance DOUBLE,
         pickup_longitude DOUBLE,
         pickup_latitude DOUBLE,
         RatecodeID BIGINT,
         store_and_fwd_flag STRING,
         dropoff_longitude DOUBLE,
         dropoff_latitude DOUBLE,
         payment_type INT,
         fare_amount DOUBLE,
         extra DOUBLE,
         mta_tax DOUBLE,
         tip_amount DOUBLE,
         tolls_amount DOUBLE,
         improvement_surcharge DOUBLE,
         total_amount DOUBLE,
         type STRING
) STORED AS PARQUET LOCATION 's3://aws-glue-temporary-<123456789012>-us-west-2/glue-blog/' TBLPROPERTIES ('classification'='parquet')
Nota bene
The S3 path ends with "/glue-blog/", corresponding to the script. YOUR-S3-BUCKET looks like aws-glue-temporary-###-us-west-2.

After about 6 minutes, the ETL job will complete. Run below SQL query in Athena.
SELECT type, count(*) FROM "nycitytaxianalysis"."canonicaldata" group by typeReturn:
| type | _col1 | |
|---|---|---|
| 1 | yellow | 10906858 |
Define ETL Job for Green Data
In Glue console, create a new ETL job, Here we name it as "NYCityTaxiGreen".
Choose "blog_green" as the source. This time, specify the existing table "canonicaldata" (created by the above step) in the data catalog as the data target. Choose the new pickup_date and dropoff_date fields for the target field types for the date variables, as shown below.
Change the data types to be timestamp rather than strings. The following table outlines the updates.
| Old Name | Target Name | Target Data Type |
| lpep_pickup_datetime | pickup_date | timestamp |
| lpep_dropoff_datetime | dropoff_date | timestamp |

Click the "Save job and edit script" button.
Insert the following two lines at the end of the top imports:
from pyspark.sql.functions import lit
from awsglue.dynamicframe import DynamicFrame
Type this line before the last sink calls. Replace the <DYNAMIC_FRAME_NAME> with the name generated in the script, in this case it is "resolvechoice4".
给来自这个数据源的每一条对应数据条目增加一个field,field的名称为type,每一个条目里这个field对应的值都是green。
##----------------------------------
#convert to a Spark DataFrame...
customDF = <DYNAMIC_FRAME_NAME>.toDF()

#add a new column for "type"
customDF = customDF.withColumn("type", lit('green'))

# Convert back to a DynamicFrame for further processing.
customDynamicFrame = DynamicFrame.fromDF(customDF, glueContext, "customDF_df")
##----------------------------------
## @type: DataSink
## @args: [database = "nycitytaxianalysis", table_name = "canonicaldata", transformation_ctx = "datasink5"]
## @return: datasink5
## @inputs: [frame = resolvechoice4]
datasink4 = glueContext.write_dynamic_frame.from_options(frame = customDynamicFrame, connection_type = "s3", connection_options = {"path": "s3://aws-glue-temporary-###-us-west-2/glue-blog/"}, format = "parquet", transformation_ctx = "datasink4")
Update from:datasink5 = glueContext.write_dynamic_frame.from_catalog(frame = resolvechoice4, database = "nycitytaxianalysis", table_name = "canonicaldata", transformation_ctx = "datasink5")to:
datasink5 = glueContext.write_dynamic_frame.from_options(frame = customDynamicFrame, connection_type = "s3", connection_options = {"path": "s3://aws-glue-temporary-###-us-west-2/glue-blog/"}, format = "parquet", transformation_ctx = "datasink5")
Full code:
import sys
from awsglue.transforms import *
from awsglue.utils import getResolvedOptions
from pyspark.context import SparkContext
from awsglue.context import GlueContext
from awsglue.job import Job
from pyspark.sql.functions import lit
from awsglue.dynamicframe import DynamicFrame

## @params: [JOB_NAME]
args = getResolvedOptions(sys.argv, ['JOB_NAME'])

sc = SparkContext()
glueContext = GlueContext(sc)
spark = glueContext.spark_session
job = Job(glueContext)
job.init(args['JOB_NAME'], args)
## @type: DataSource
## @args: [database = "nycitytaxianalysis", table_name = "blog_green", transformation_ctx = "datasource0"]
## @return: datasource0
## @inputs: []
datasource0 = glueContext.create_dynamic_frame.from_catalog(database = "nycitytaxianalysis", table_name = "blog_green", transformation_ctx = "datasource0")
## @type: ApplyMapping
## @args: [mapping = [("vendorid", "long", "vendorid", "int"), ("lpep_pickup_datetime", "string", "pickup_date", "timestamp"), ("lpep_dropoff_datetime", "string", "dropoff_date", "timestamp"), ("store_and_fwd_flag", "string", "store_and_fwd_flag", "string"), ("ratecodeid", "long", "ratecodeid", "long"), ("pickup_longitude", "double", "pickup_longitude", "double"), ("pickup_latitude", "double", "pickup_latitude", "double"), ("dropoff_longitude", "double", "dropoff_longitude", "double"), ("dropoff_latitude", "double", "dropoff_latitude", "double"), ("passenger_count", "long", "passenger_count", "long"), ("trip_distance", "double", "trip_distance", "double"), ("fare_amount", "double", "fare_amount", "double"), ("extra", "double", "extra", "double"), ("mta_tax", "double", "mta_tax", "double"), ("tip_amount", "double", "tip_amount", "double"), ("tolls_amount", "double", "tolls_amount", "double"), ("improvement_surcharge", "double", "improvement_surcharge", "double"), ("total_amount", "double", "total_amount", "double"), ("payment_type", "long", "payment_type", "int")], transformation_ctx = "applymapping1"]
## @return: applymapping1
## @inputs: [frame = datasource0]
applymapping1 = ApplyMapping.apply(frame = datasource0, mappings = [("vendorid", "long", "vendorid", "int"), ("lpep_pickup_datetime", "string", "pickup_date", "timestamp"), ("lpep_dropoff_datetime", "string", "dropoff_date", "timestamp"), ("store_and_fwd_flag", "string", "store_and_fwd_flag", "string"), ("ratecodeid", "long", "ratecodeid", "long"), ("pickup_longitude", "double", "pickup_longitude", "double"), ("pickup_latitude", "double", "pickup_latitude", "double"), ("dropoff_longitude", "double", "dropoff_longitude", "double"), ("dropoff_latitude", "double", "dropoff_latitude", "double"), ("passenger_count", "long", "passenger_count", "long"), ("trip_distance", "double", "trip_distance", "double"), ("fare_amount", "double", "fare_amount", "double"), ("extra", "double", "extra", "double"), ("mta_tax", "double", "mta_tax", "double"), ("tip_amount", "double", "tip_amount", "double"), ("tolls_amount", "double", "tolls_amount", "double"), ("improvement_surcharge", "double", "improvement_surcharge", "double"), ("total_amount", "double", "total_amount", "double"), ("payment_type", "long", "payment_type", "int")], transformation_ctx = "applymapping1")
## @type: SelectFields
## @args: [paths = ["vendorid", "pickup_date", "dropoff_date", "passenger_count", "trip_distance", "pickup_longitude", "pickup_latitude", "ratecodeid", "store_and_fwd_flag", "dropoff_longitude", "dropoff_latitude", "payment_type", "fare_amount", "extra", "mta_tax", "tip_amount", "tolls_amount", "improvement_surcharge", "total_amount", "type"], transformation_ctx = "selectfields2"]
## @return: selectfields2
## @inputs: [frame = applymapping1]
selectfields2 = SelectFields.apply(frame = applymapping1, paths = ["vendorid", "pickup_date", "dropoff_date", "passenger_count", "trip_distance", "pickup_longitude", "pickup_latitude", "ratecodeid", "store_and_fwd_flag", "dropoff_longitude", "dropoff_latitude", "payment_type", "fare_amount", "extra", "mta_tax", "tip_amount", "tolls_amount", "improvement_surcharge", "total_amount", "type"], transformation_ctx = "selectfields2")
## @type: ResolveChoice
## @args: [choice = "MATCH_CATALOG", database = "nycitytaxianalysis", table_name = "canonicaldata", transformation_ctx = "resolvechoice3"]
## @return: resolvechoice3
## @inputs: [frame = selectfields2]
resolvechoice3 = ResolveChoice.apply(frame = selectfields2, choice = "MATCH_CATALOG", database = "nycitytaxianalysis", table_name = "canonicaldata", transformation_ctx = "resolvechoice3")
## @type: ResolveChoice
## @args: [choice = "make_struct", transformation_ctx = "resolvechoice4"]
## @return: resolvechoice4
## @inputs: [frame = resolvechoice3]
resolvechoice4 = ResolveChoice.apply(frame = resolvechoice3, choice = "make_struct", transformation_ctx = "resolvechoice4")

##----------------------------------
#convert to a Spark DataFrame...
customDF = resolvechoice4.toDF()

#add a new column for "type"
customDF = customDF.withColumn("type", lit('green'))

# Convert back to a DynamicFrame for further processing.
customDynamicFrame = DynamicFrame.fromDF(customDF, glueContext, "customDF_df")

## @type: DataSink
## @args: [database = "nycitytaxianalysis", table_name = "canonicaldata", transformation_ctx = "datasink5"]
## @return: datasink5
## @inputs: [frame = resolvechoice4]
datasink5 = glueContext.write_dynamic_frame.from_options(frame = customDynamicFrame, connection_type = "s3", connection_options = {"path": "s3://aws-glue-temporary-123456789012-us-west-2/glue-blog/"}, format = "parquet", transformation_ctx = "datasink5")
job.commit()
Run the same SQL query as the previous one, in Athena.
SELECT type, count(*) FROM "nycitytaxianalysis"."canonicaldata" group by type;Return:
| type | _col1 | |
|---|---|---|
| 1 | yellow | 10906858 |
| 2 | green | 12352144 |
Define ETL Job for FHV data
You have one more dataset to convert, so create a new ETL job. Name the job "NYCityTaxiFHV".
Choose "blog_fhv" as the source.
Specify the existing table "canonicaldata" in the data catalog as the data target.
This dataset is limited as it only has 3 fields, one of which you are converting.
Choose "–" (dash) for the dispatcher (dispatching_base_num) and location (locationid), and map the pickup_ date to the canonical field (pickup_date) (currently, nothing changed).

Click the "Save job and edit script" button.
In the script, insert the following two lines at the end of the top imports:
from pyspark.sql.functions import lit
from awsglue.dynamicframe import DynamicFrame
Find the last call before the the line that start with the datasink. This is the DynamicFrame that is being used to write out the data.
Now convert that to a DataFrame. Replace the <DYNAMIC_FRAME_NAME> with the name generated in the script, in this case it is "resolvechoice4".
Insert this code before the last sink call.
##----------------------------------
#convert to a Spark DataFrame...
customDF = <DYNAMIC_FRAME_NAME>.toDF()

#add a new column for "type"
customDF = customDF.withColumn("type", lit('fhv'))

# Convert back to a DynamicFrame for further processing.
customDynamicFrame = DynamicFrame.fromDF(customDF, glueContext, "customDF_df")
##----------------------------------
Insert above code before this code block:## @type: DataSink ## @args: [database = "nycitytaxianalysis", table_name = "canonicaldata", transformation_ctx = "datasink5"] ## @return: datasink5 ## @inputs: [frame = resolvechoice4] datasink5 = glueContext.write_dynamic_frame.from_catalog(frame = resolvechoice4, database = "nycitytaxianalysis", table_name = "canonicaldata", transformation_ctx = "datasink5")
And update below code from:
datasink5 = glueContext.write_dynamic_frame.from_catalog(frame = resolvechoice4, database = "nycitytaxianalysis", table_name = "canonicaldata", transformation_ctx = "datasink5")to:
datasink5 = glueContext.write_dynamic_frame.from_options(frame = customDynamicFrame, connection_type = "s3", connection_options = {"path": "s3://aws-glue-temporary-###-us-west-2/glue-blog/"}, format = "parquet", transformation_ctx = "datasink5")
Full code:import sys
from awsglue.transforms import *
from awsglue.utils import getResolvedOptions
from pyspark.context import SparkContext
from awsglue.context import GlueContext
from awsglue.job import Job
from pyspark.sql.functions import lit
from awsglue.dynamicframe import DynamicFrame
## @params: [JOB_NAME]
args = getResolvedOptions(sys.argv, ['JOB_NAME'])
sc = SparkContext()
glueContext = GlueContext(sc)
spark = glueContext.spark_session
job = Job(glueContext)
job.init(args['JOB_NAME'], args)
## @type: DataSource
## @args: [database = "nycitytaxianalysis", table_name = "blog_fhv", transformation_ctx = "datasource0"]
## @return: datasource0
## @inputs: []
datasource0 = glueContext.create_dynamic_frame.from_catalog(database = "nycitytaxianalysis", table_name = "blog_fhv", transformation_ctx = "datasource0")
## @type: ApplyMapping
## @args: [mapping = [("pickup_date", "string", "pickup_date", "timestamp")], transformation_ctx = "applymapping1"]
## @return: applymapping1
## @inputs: [frame = datasource0]
applymapping1 = ApplyMapping.apply(frame = datasource0, mappings = [("pickup_date", "string", "pickup_date", "timestamp")], transformation_ctx = "applymapping1")
## @type: SelectFields
## @args: [paths = ["vendorid", "pickup_date", "dropoff_date", "passenger_count", "trip_distance", "pickup_longitude", "pickup_latitude", "ratecodeid", "store_and_fwd_flag", "dropoff_longitude", "dropoff_latitude", "payment_type", "fare_amount", "extra", "mta_tax", "tip_amount", "tolls_amount", "improvement_surcharge", "total_amount", "type"], transformation_ctx = "selectfields2"]
## @return: selectfields2
## @inputs: [frame = applymapping1]
selectfields2 = SelectFields.apply(frame = applymapping1, paths = ["vendorid", "pickup_date", "dropoff_date", "passenger_count", "trip_distance", "pickup_longitude", "pickup_latitude", "ratecodeid", "store_and_fwd_flag", "dropoff_longitude", "dropoff_latitude", "payment_type", "fare_amount", "extra", "mta_tax", "tip_amount", "tolls_amount", "improvement_surcharge", "total_amount", "type"], transformation_ctx = "selectfields2")
## @type: ResolveChoice
## @args: [choice = "MATCH_CATALOG", database = "nycitytaxianalysis", table_name = "canonicaldata", transformation_ctx = "resolvechoice3"]
## @return: resolvechoice3
## @inputs: [frame = selectfields2]
resolvechoice3 = ResolveChoice.apply(frame = selectfields2, choice = "MATCH_CATALOG", database = "nycitytaxianalysis", table_name = "canonicaldata", transformation_ctx = "resolvechoice3")
## @type: ResolveChoice
## @args: [choice = "make_struct", transformation_ctx = "resolvechoice4"]
## @return: resolvechoice4
## @inputs: [frame = resolvechoice3]
resolvechoice4 = ResolveChoice.apply(frame = resolvechoice3, choice = "make_struct", transformation_ctx = "resolvechoice4")
##----------------------------------
#convert to a Spark DataFrame...
customDF = resolvechoice4.toDF()
#add a new column for "type"
customDF = customDF.withColumn("type", lit('fhv'))
# Convert back to a DynamicFrame for further processing.
customDynamicFrame = DynamicFrame.fromDF(customDF, glueContext, "customDF_df")
##----------------------------------
## @type: DataSink
## @args: [database = "nycitytaxianalysis", table_name = "canonicaldata", transformation_ctx = "datasink5"]
## @return: datasink5
## @inputs: [frame = resolvechoice4]
datasink5 = glueContext.write_dynamic_frame.from_options(frame = customDynamicFrame, connection_type = "s3", connection_options = {"path": "s3://aws-glue-temporary-123456789012-us-west-2/glue-blog/"}, format = "parquet", transformation_ctx = "datasink5")
job.commit()
Save and then run job.
After about 4 minutes, the ETL job should complete. Run the same SQL query as the previous one, in Athena.
SELECT type, count(*) FROM "nycitytaxianalysis"."canonicaldata" group by type;Return:
| type | _col1 | |
|---|---|---|
| 1 | yellow | 10906858 |
| 2 | fhv | 8659987 |
| 3 | green | 12352144 |
Run below SQL query in Athena.
SELECT min(trip_distance) AS minDistance,
       max(trip_distance) AS maxDistance,
       min(total_amount) AS minTotal,
       max(total_amount) AS maxTotal
FROM "nycitytaxianalysis"."canonicaldata";
Return:| minDistance | maxDistance | minTotal | maxTotal | |
|---|---|---|---|---|
| 1 | 0.0 | 8000010.0 | -958.4 | 111271.65 |
Remember the data dict for Yellow and Green. Re-post here:
| Field Name | Description |
| trip_distance | The elapsed trip distance in miles reported by the taximeter. |
| total_amount | The total amount charged to passengers. PS: Does not include cash tips. |
Run below SQL query in Athena.
SELECT TYPE,
       avg(trip_distance) AS avgDist,
       avg(total_amount/trip_distance) AS avgCostPerMile
FROM "nycitytaxianalysis"."canonicaldata"
WHERE trip_distance > 0
  AND total_amount > 0
GROUP BY TYPE;
Return:| type | avgDist | avgCostPerMile | |
|---|---|---|---|
| 1 | green | 4.460172564911156 | 7.447596834344573 |
| 2 | yellow | 4.676942730048546 | 8.374197225225656 |
Run below SQL query in Athena.
SELECT TYPE,
       avg(trip_distance) avgDistance,
       avg(total_amount/trip_distance) avgCostPerMile,
       avg(total_amount) avgCost,
       approx_percentile(total_amount, .99) percentile99
FROM "nycitytaxianalysis"."canonicaldata"
WHERE trip_distance > 0 and total_amount > 0
GROUP BY TYPE;
Return:| TYPE | avgDistance | avgCostPerMile | avgCost | percentile99 | |
|---|---|---|---|---|---|
| 1 | green | 4.460172564911154 | 7.44759683434457 | 13.847251500201278 | 69.99 |
| 2 | yellow | 4.6769427300485455 | 8.374197225225657 | 15.593192205161714 | 69.99 |
Visualizing the Data in QuickSight
Amazon QuickSight is a data visualization service you can use to analyze the data that you just combined. For more detailed instructions, see the Amazon QuickSight User Guide.Login QuickSight console for the Oregon region via URL https://us-west-2.quicksight.aws.amazon.com/sn/start.
Create a new dataset for NY taxi data
Create a new Athena data source. (Create a Dataset, FROM NEW DATA SOURCES: Athena)
Data source name: nyctlcdemo. For Athena workgroup, select "[primary]".

Point it to the canonical taxi data. (Database: nycitytaxianalysis; Tables: canonicaldata)

Click Edit/Preview data button.
Add a new calculated field named HourOfDay.

extract('HH', {pickup_date})
Choose Save and Visualize.
Choose Save & Publish.
Choose Publish & Visualize.
Choose Interactive sheet.
You can now visualize this dataset and query through Athena the canonical dataset on S3 that has been converted by Glue.
Selecting HourOfDay allows you to see how many taxi rides there are based on the hour of the day. This is a calculated field that is being derived by the timestamp in the raw dataset.

You can also deselect that and choose type to see the total counts again by type.

Now choose the pickup_date field in addition to the type field and notice that the plot type automatically changed. Because time is being used, it’s showing a time chart defaulting to the year.
Click "pickup_data" under the "X axis". From "Aggregate", click "Day" to choose a day interval instead.

Expand the x axis to zoom out. You can clearly see a large drop in all rides on January 23, 2016.

Summary
In the post, you went from data investigation to analyzing and visualizing a canonical dataset, without starting a single server. You started by crawling a dataset you didn’t know anything about and the crawler told you the structure, columns, and counts of records.From there, you saw that all three datasets were in different formats, but represented the same thing: NY City Taxi rides. You then converted them into a canonical (or normalized) form that is easily queried through Athena and QuickSight, in addition to a wide number of different tools not covered in this post.
Reference
AWS Big Data Blog (Tag: AWS Glue)
New York City Taxi Records dataset
Harmonize, Query, and Visualize Data from Various Providers using AWS Glue, Amazon Athena, and Amazon QuickSight
Build a Data Lake Foundation with AWS Glue and Amazon S3 (This one could be used as a complement of the above one, which is more depth but lack a little bit description.)
TLC Trip Records User Guide
-