Deliver better Insights of your cloud bills using KubeCost and AWS CUR
2023年03月18日
2. An accessible Amazon EKS cluster.
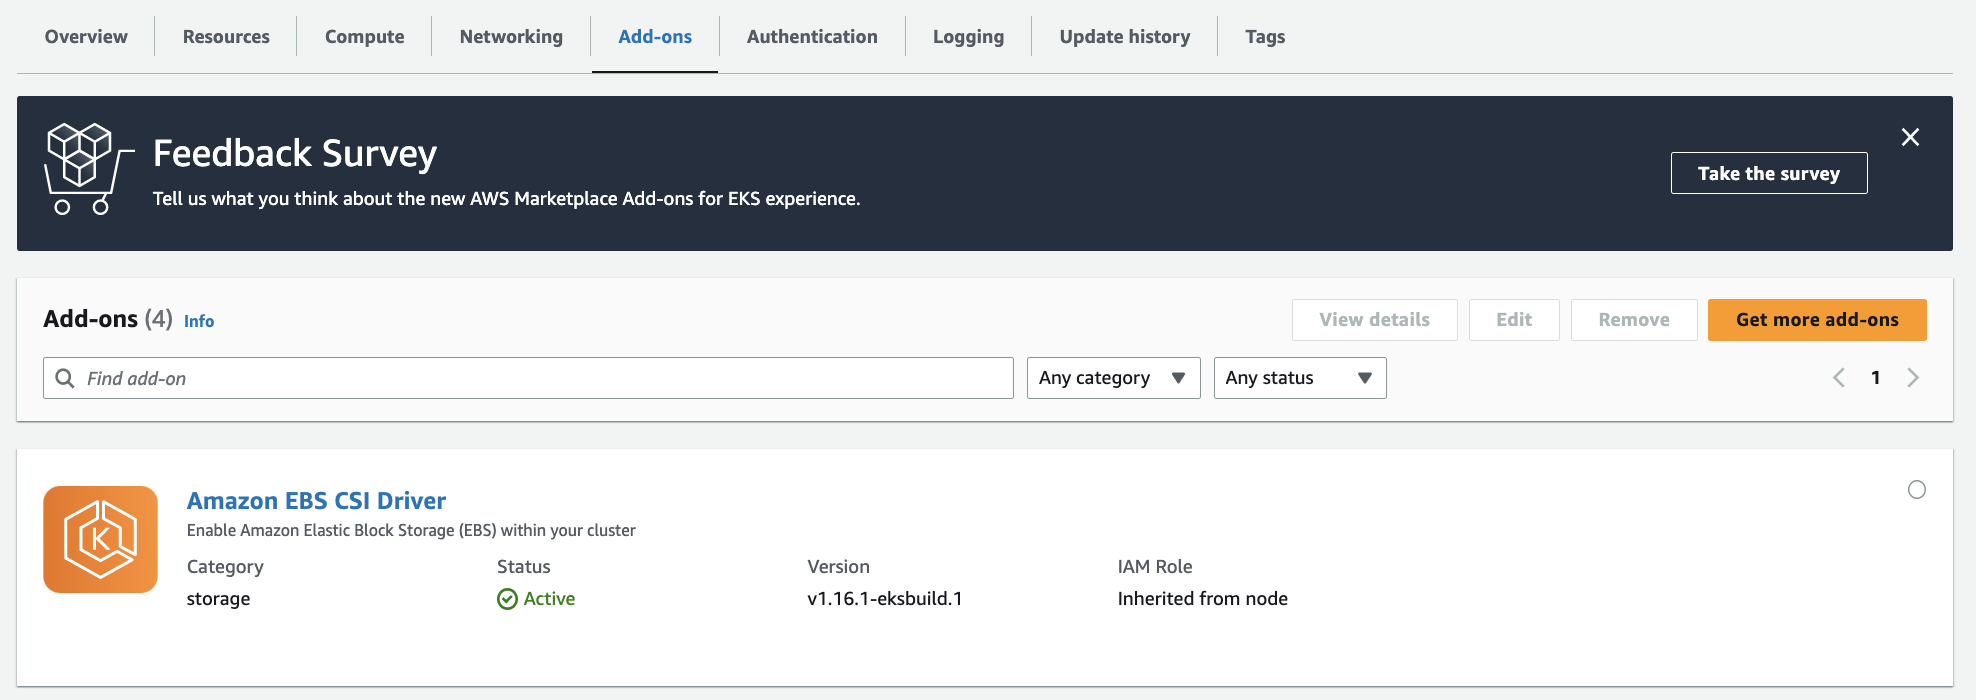
3. If your cluster is running Kubernetes version 1.23 or later, you must have the Amazon EBS CSI driver installed on your cluster.
Step 1: Install Kubecost on your Amazon EKS cluster.
In your environment, run the following command from your terminal to install Kubecost on your existing Amazon EKS cluster.
To install Kubecost on Amazon EKS cluster on AWS Graviton2 (ARM-based processor) with verion 1.108.0 (current latest version):
Note
The "-i" flag instructs the Helm command line that if a release by this name (kubecost) doesn't already exist, then run an install.
Find all available versions of the EKS optimized Kubecost bundle here:kubecost/cost-analyzer.
By default, the installation includes certain prerequisite software including Prometheus and kube-state-metrics.
% kubectl get pod -n kubecost
To customize your deployment (e.g., skipping these prerequisites if you already have them running in your cluster), you can find a list of available configuration options in the Helm configuration file.
Step 2: Generate Kubecost dashboard endpoint.
After you install Kubecost using the Helm command in step 2, it should take under two minutes to be completed. You can run the following command to enable port-forwarding to expose the Kubecost dashboard: % kubectl port-forward --namespace kubecost deployment/kubecost-cost-analyzer 9090
Step 3: Access cost monitoring dashboard.
On your web browser, navigate to http://localhost:9090 to access the dashboard.
% kubectl get svc -n kubecost
% kubectl get svc -n kubecost
% k get cm -o yaml kubecost-cost-analyzer -n kubecost
% kubectl get pods -l app=cost-analyzer -n kubecost -o yaml | grep serviceAccount
Create IAM role
Inline policy:
Trust relationship:
Add an annotation to that service account as described in the AWS document.
% kubectl edit sa kubecost-cost-analyzer -n kubecost
s3://aws-athena-query-results-us-east-1-<111122223333>/
Troubleshooting
% kubectl logs -l app=cost-analyzer -n kubecost -c cost-model
You can now start monitoring your Amazon EKS cluster cost and efficiency. Depending on your organization's requirements and set up, there are several options to expose Kubecost for on-going internal access. There are few examples that you can use for your references:
Cluster overview
Use Kubecost to quickly see an overview of Amazon EKS spend, including cumulative cluster costs, associated Kubernetes asset costs, and monthly aggregated spend.
Cost allocation by namespace
View monthly Amazon EKS costs as well as cumulative costs per namespace and other dimensions up to the last 15 days. This enables you to better understand which parts of your application are contributing to Amazon EKS spend.
Spend and usage for other AWS Services associated with Amazon EKS clusters
View the costs of AWS infrastructure assets that are associated with their EKS resources.
Kubecost reading metrics
With this pre-installed Prometheus, you can also write queries to ingest Kubecost data in your current business intelligence system for further analysis. You can also use it as a datasource for your current Grafana dashboard to display Amazon EKS cluster cost that your internal teams are familiar with. To learn more about how to write Prometheus queries, review Kubecost’s documentation or use example Grafana JSON models in the Kubecost Github repository as references.
AWS Cost and Usage Report (AWS CUR) integration
To perform cost allocation calculations for your Amazon EKS cluster, Kubecost retrieves the public pricing information of AWS services and resources from AWS Price List API. You can also integrate Kubecost with the AWS CUR to enhance the accuracy of pricing information that is specific to your AWS account (e.g., Enterprise Discount Programs, Reserved Instance usage, Savings Plans, and Spot usage). You can learn more on how the AWS CUR integration works at AWS Cloud Integration.
Label the Node: First, you should label the specific node where you want the pod to be scheduled. You can do this using the
% kubectl label nodes <node-name> mykey=myvalue
Taint the Node: Next, you should taint the node to ensure that no other pods are scheduled on it unless they tolerate this taint. Use the
% kubectl taint nodes <node-name> disksize=large:NoSchedule
Patch file:
-
References
AWS and Kubecost collaborate to deliver cost monitoring for EKS customers
Cost monitoring
Amazon EKS Integration
[Revision history]
[2023.03.18] First installing kubecost version 1.101.2.
[2024.01.04] Update kubecost version from 1.101.2 to 1.108.0.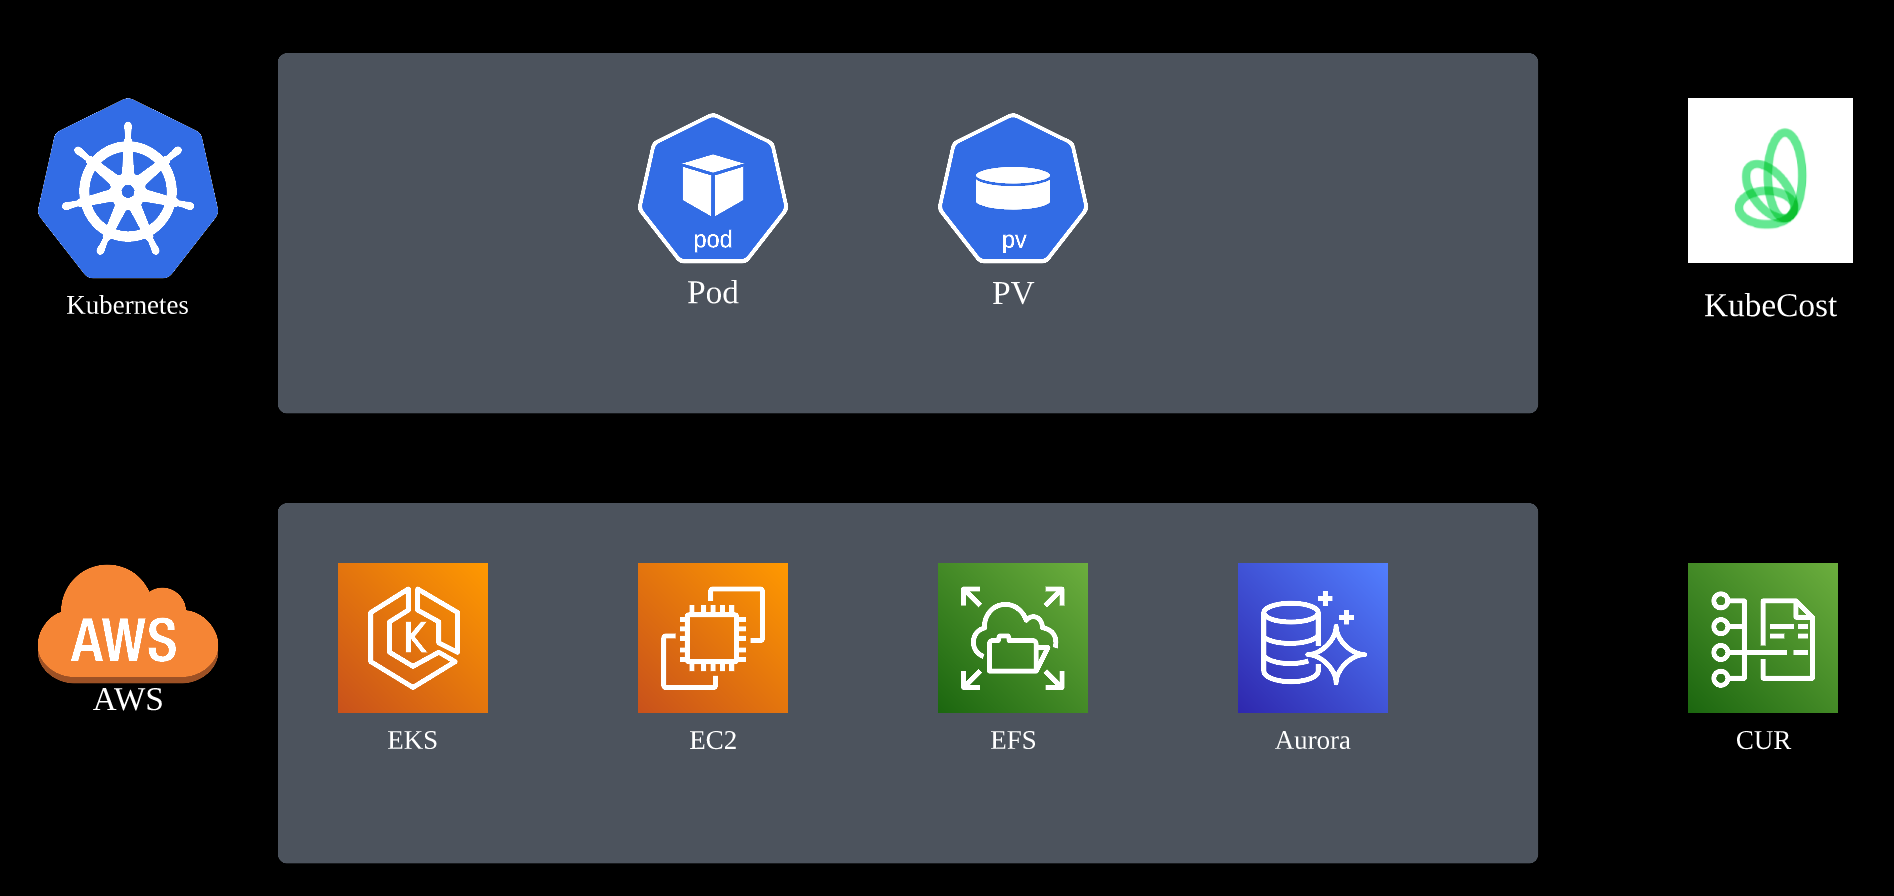
Prerequisites:
1. Install the following tools: Helm 3.9+, kubectl, and optionally eksctl and awscli.
% helm version
version.BuildInfo{Version:"v3.9.1", GitCommit:"a7c043acb5ff905c261cfdc923a35776ba5e66e4", GitTreeState:"clean", GoVersion:"go1.17.5"}
2. An accessible Amazon EKS cluster.
3. If your cluster is running Kubernetes version 1.23 or later, you must have the Amazon EBS CSI driver installed on your cluster.
Step 1: Install Kubecost on your Amazon EKS cluster.
In your environment, run the following command from your terminal to install Kubecost on your existing Amazon EKS cluster.
helm upgrade -i kubecost \
oci://public.ecr.aws/kubecost/cost-analyzer --version 1.101.2 \
--namespace kubecost --create-namespace \
-f https://raw.githubusercontent.com/kubecost/cost-analyzer-helm-chart/develop/cost-analyzer/values-eks-cost-monitoring.yaml
Returned:
Release "kubecost" does not exist. Installing it now.
NAME: kubecost
LAST DEPLOYED: Sat Mar 18 12:40:00 2023
NAMESPACE: kubecost
STATUS: deployed
REVISION: 1
TEST SUITE: None
NOTES:
--------------------------------------------------Kubecost has been successfully installed.

WARNING: ON EKS v1.23+ INSTALLATION OF EBS-CSI DRIVER IS REQUIRED TO MANAGE PERSISTENT VOLUMES. LEARN MORE HERE: https://docs.kubecost.com/install-and-configure/install/provider-installations/aws-eks-cost-monitoring#prerequisites

Please allow 5-10 minutes for Kubecost to gather metrics.

If you have configured cloud-integrations, it can take up to 48 hours for cost reconciliation to occur.

When using Durable storage (Enterprise Edition), please allow up to 4 hours for data to be collected and the UI to be healthy.

When pods are Ready, you can enable port-forwarding with the following command:

    kubectl port-forward --namespace kubecost deployment/kubecost-cost-analyzer 9090

Next, navigate to http://localhost:9090 in a web browser.

Having installation issues? View our Troubleshooting Guide at http://docs.kubecost.com/troubleshoot-install
To install Kubecost on Amazon EKS cluster on AWS Graviton2 (ARM-based processor) with verion 1.108.0 (current latest version):
helm upgrade -i kubecost \
oci://public.ecr.aws/kubecost/cost-analyzer --version 1.108.0 \
--namespace kubecost --create-namespace \
-f https://raw.githubusercontent.com/kubecost/cost-analyzer-helm-chart/develop/cost-analyzer/values-eks-cost-monitoring.yaml \
--set prometheus.configmapReload.prometheus.image.repository=jimmidyson/configmap-reload \
--set prometheus.configmapReload.prometheus.image.tag=v0.7.1
Returned:
WARNING: Kubernetes configuration file is group-readable. This is insecure. Location: /home/ec2-user/.kube/config
WARNING: Kubernetes configuration file is world-readable. This is insecure. Location: /home/ec2-user/.kube/config
Release "kubecost" does not exist. Installing it now.
Pulled: public.ecr.aws/kubecost/cost-analyzer:1.108.0
Digest: sha256:b2f23af7c75310e7779c364d1aac8326a73525b2b250b16276d2bd8e364d9468
NAME: kubecost
LAST DEPLOYED: Fri Jan  5 02:46:04 2024
NAMESPACE: kubecost
STATUS: deployed
REVISION: 1
NOTES:
--------------------------------------------------
Kubecost 1.108.0 has been successfully installed.

WARNING: ON EKS v1.23+ INSTALLATION OF EBS-CSI DRIVER IS REQUIRED TO MANAGE PERSISTENT VOLUMES. LEARN MORE HERE: https://docs.kubecost.com/install-and-configure/install/provider-installations/aws-eks-cost-monitoring#prerequisites

Please allow 5-10 minutes for Kubecost to gather metrics.

When configured, cost reconciliation with cloud provider billing data will have a 48 hour delay.

When pods are Ready, you can enable port-forwarding with the following command:

    kubectl port-forward --namespace kubecost deployment/kubecost-cost-analyzer 9090

Then, navigate to http://localhost:9090 in a web browser.

Having installation issues? View our Troubleshooting Guide at http://docs.kubecost.com/troubleshoot-install
Note
The "-i" flag instructs the Helm command line that if a release by this name (kubecost) doesn't already exist, then run an install.
Find all available versions of the EKS optimized Kubecost bundle here:kubecost/cost-analyzer.
By default, the installation includes certain prerequisite software including Prometheus and kube-state-metrics.
% kubectl get pod -n kubecost
NAME                                           READY   STATUS    RESTARTS   AGE
kubecost-cost-analyzer-6bb8fcbb95-c6klr        2/2     Running   0          119s
kubecost-kube-state-metrics-78d486cd4b-rzl86   1/1     Running   0          119s
kubecost-prometheus-server-fd44c55d4-49tzz     1/1     Running   0          119s
PS:新版已经没有kube-state-metrics这个组件了:
NAME                                         READY   STATUS    RESTARTS   AGE
kubecost-cost-analyzer-5cb6fd4f9d-t6d94      2/2     Running   0          3h38m
kubecost-prometheus-server-fd678dff7-tq6wp   1/1     Running   0          3h38m
To customize your deployment (e.g., skipping these prerequisites if you already have them running in your cluster), you can find a list of available configuration options in the Helm configuration file.
Step 2: Generate Kubecost dashboard endpoint.
After you install Kubecost using the Helm command in step 2, it should take under two minutes to be completed. You can run the following command to enable port-forwarding to expose the Kubecost dashboard: % kubectl port-forward --namespace kubecost deployment/kubecost-cost-analyzer 9090
Forwarding from 127.0.0.1:9090 -> 9090
Forwarding from [::1]:9090 -> 9090
Step 3: Access cost monitoring dashboard.
On your web browser, navigate to http://localhost:9090 to access the dashboard.
% kubectl get svc -n kubecost
NAME                          TYPE        CLUSTER-IP       EXTERNAL-IP   PORT(S)             AGE
kubecost-cost-analyzer        ClusterIP   172.20.100.155   <none>        9003/TCP,9090/TCP   3h39m
kubecost-kube-state-metrics   ClusterIP   172.20.211.63    <none>        8080/TCP            3h39m
kubecost-prometheus-server    ClusterIP   172.20.151.112   <none>        80/TCP              3h39m
新版已经没有kube-state-metrics这个组件了:
% kubectl get svc -n kubecost
NAME                         TYPE        CLUSTER-IP      EXTERNAL-IP   PORT(S)             AGE
kubecost-cost-analyzer       ClusterIP   172.20.201.13   <none>        9003/TCP,9090/TCP   3h49m
kubecost-prometheus-server   ClusterIP   172.20.174.0    <none>        80/TCP              3h49m
% k get cm -o yaml kubecost-cost-analyzer -n kubecost
apiVersion: v1
data:
  kubecost-token: not-applied
  prometheus-alertmanager-endpoint: http://kubecost-prometheus-alertmanager.kubecost
  prometheus-server-endpoint: http://kubecost-prometheus-server.kubecost
kind: ConfigMap
metadata:
  annotations:
    meta.helm.sh/release-name: kubecost
    meta.helm.sh/release-namespace: kubecost
  creationTimestamp: "2023-03-18T04:40:48Z"
  labels:
    app: cost-analyzer
    app.kubernetes.io/instance: kubecost
    app.kubernetes.io/managed-by: Helm
    app.kubernetes.io/name: cost-analyzer
    helm.sh/chart: cost-analyzer-1.101.2
  name: kubecost-cost-analyzer
  namespace: kubecost
  resourceVersion: "986756727"
  uid: 64565b7e-bd54-427e-a946-602531b87bd9
% kubectl get pods -l app=cost-analyzer -n kubecost -o yaml | grep serviceAccount
    serviceAccount: kubecost-cost-analyzer
    serviceAccountName: kubecost-cost-analyzer
        - serviceAccountToken:
Create IAM role
Inline policy:
{
    "Version": "2012-10-17",
    "Statement": [
        {
            "Sid": "AthenaAccess",
            "Effect": "Allow",
            "Action": [
                "athena:*"
            ],
            "Resource": [
                "*"
            ]
        },
        {
            "Sid": "ReadAccessToAthenaCurDataViaGlue",
            "Effect": "Allow",
            "Action": [
                "glue:GetDatabase*",
                "glue:GetTable*",
                "glue:GetPartition*",
                "glue:GetUserDefinedFunction",
                "glue:BatchGetPartition"
            ],
            "Resource": [
                "arn:aws:glue:*:*:catalog",
                "arn:aws:glue:*:*:database/aws_billing_report",
                "arn:aws:glue:*:*:table/aws_billing_report/my_cur_report"
            ]
        },
        {
            "Sid": "AthenaQueryResultsOutput",
            "Effect": "Allow",
            "Action": [
                "s3:GetBucketLocation",
                "s3:GetObject",
                "s3:ListBucket",
                "s3:ListBucketMultipartUploads",
                "s3:ListMultipartUploadParts",
                "s3:AbortMultipartUpload",
                "s3:CreateBucket",
                "s3:PutObject"
            ],
            "Resource": [
                "arn:aws:s3:::aws-athena-query-results-*"
            ]
        },
        {
            "Sid": "S3ReadAccessToAwsBillingData",
            "Effect": "Allow",
            "Action": [
                "s3:Get*",
                "s3:List*"
            ],
            "Resource": [
                "arn:aws:s3:::aws-athena-query-results-us-east-1-<111122223333>*",
                "arn:aws:s3:::tz-billing*",
                "arn:aws:s3:::cost-n-usage*"
            ]
        }
    ]
}
Trust relationship:
{
    "Version": "2012-10-17",
    "Statement": [
        {
            "Effect": "Allow",
            "Principal": {
                "Federated": "arn:aws:iam::<111122223333>:oidc-provider/oidc.eks.us-west-2.amazonaws.com/id/BFDB****D49F"
            },
            "Action": "sts:AssumeRoleWithWebIdentity",
            "Condition": {
                "StringEquals": {
                    "oidc.eks.us-west-2.amazonaws.com/id/BFDB****D49F:aud": "sts.amazonaws.com"
                }
            }
        }
    ]
}
-Add an annotation to that service account as described in the AWS document.
% kubectl edit sa kubecost-cost-analyzer -n kubecost
apiVersion: v1
kind: ServiceAccount
metadata:
  annotations:
    eks.amazonaws.com/role-arn: arn:aws:iam::<111122223333>:role/k8s-kubecost
...
s3://aws-athena-query-results-us-east-1-<111122223333>/
Troubleshooting
% kubectl logs -l app=cost-analyzer -n kubecost -c cost-model
2023-03-18T08:55:49.760886665Z INF Unable to sniff out cluster ID, perhaps set $AWS_CLUSTER_ID to force one
2023-03-18T08:56:48.357820147Z INF Unable to sniff out cluster ID, perhaps set $AWS_CLUSTER_ID to force one
2023-03-18T08:56:52.269876066Z INF Unable to sniff out cluster ID, perhaps set $AWS_CLUSTER_ID to force one
2023-03-18T08:56:57.428143883Z INF aggregation: cache warming defaults: 1d::::::::namespace::::weighted:false:false:true
2023-03-18T08:56:57.428251559Z INF ComputeAggregateCostModel: missed cache: 1d:1m:1.000000h:false (found true, disableAggregateCostModelCache true, noCache false)
2023-03-18T08:56:57.53892525Z INF ComputeAggregateCostModel: setting L2 cache: 1d:1m:1.000000h:false
2023-03-18T08:56:57.540436481Z INF ComputeAggregateCostModel: setting aggregate cache: 1d::::::::namespace::::weighted:false:false:true
2023-03-18T08:56:57.55354711Z INF caching 1d cluster costs for 11m0s
2023-03-18T08:56:57.553592558Z INF aggregation: warm cache: 1d
2023-03-18T08:57:48.357485205Z INF Unable to sniff out cluster ID, perhaps set $AWS_CLUSTER_ID to force one
You can now start monitoring your Amazon EKS cluster cost and efficiency. Depending on your organization's requirements and set up, there are several options to expose Kubecost for on-going internal access. There are few examples that you can use for your references:
- Check out the Kubecost documentation for Ingress Examples as a reference for using Nginx ingress controller with basic auth.
- Consider using the AWS Load Balancer Controller to expose Kubecost and use Amazon Cognito for authentication, authorization, and user management. You can learn more this How to use Application Load Balancer and Amazon Cognito to authenticate users for your Kubernetes web apps
Cluster overview
Use Kubecost to quickly see an overview of Amazon EKS spend, including cumulative cluster costs, associated Kubernetes asset costs, and monthly aggregated spend.
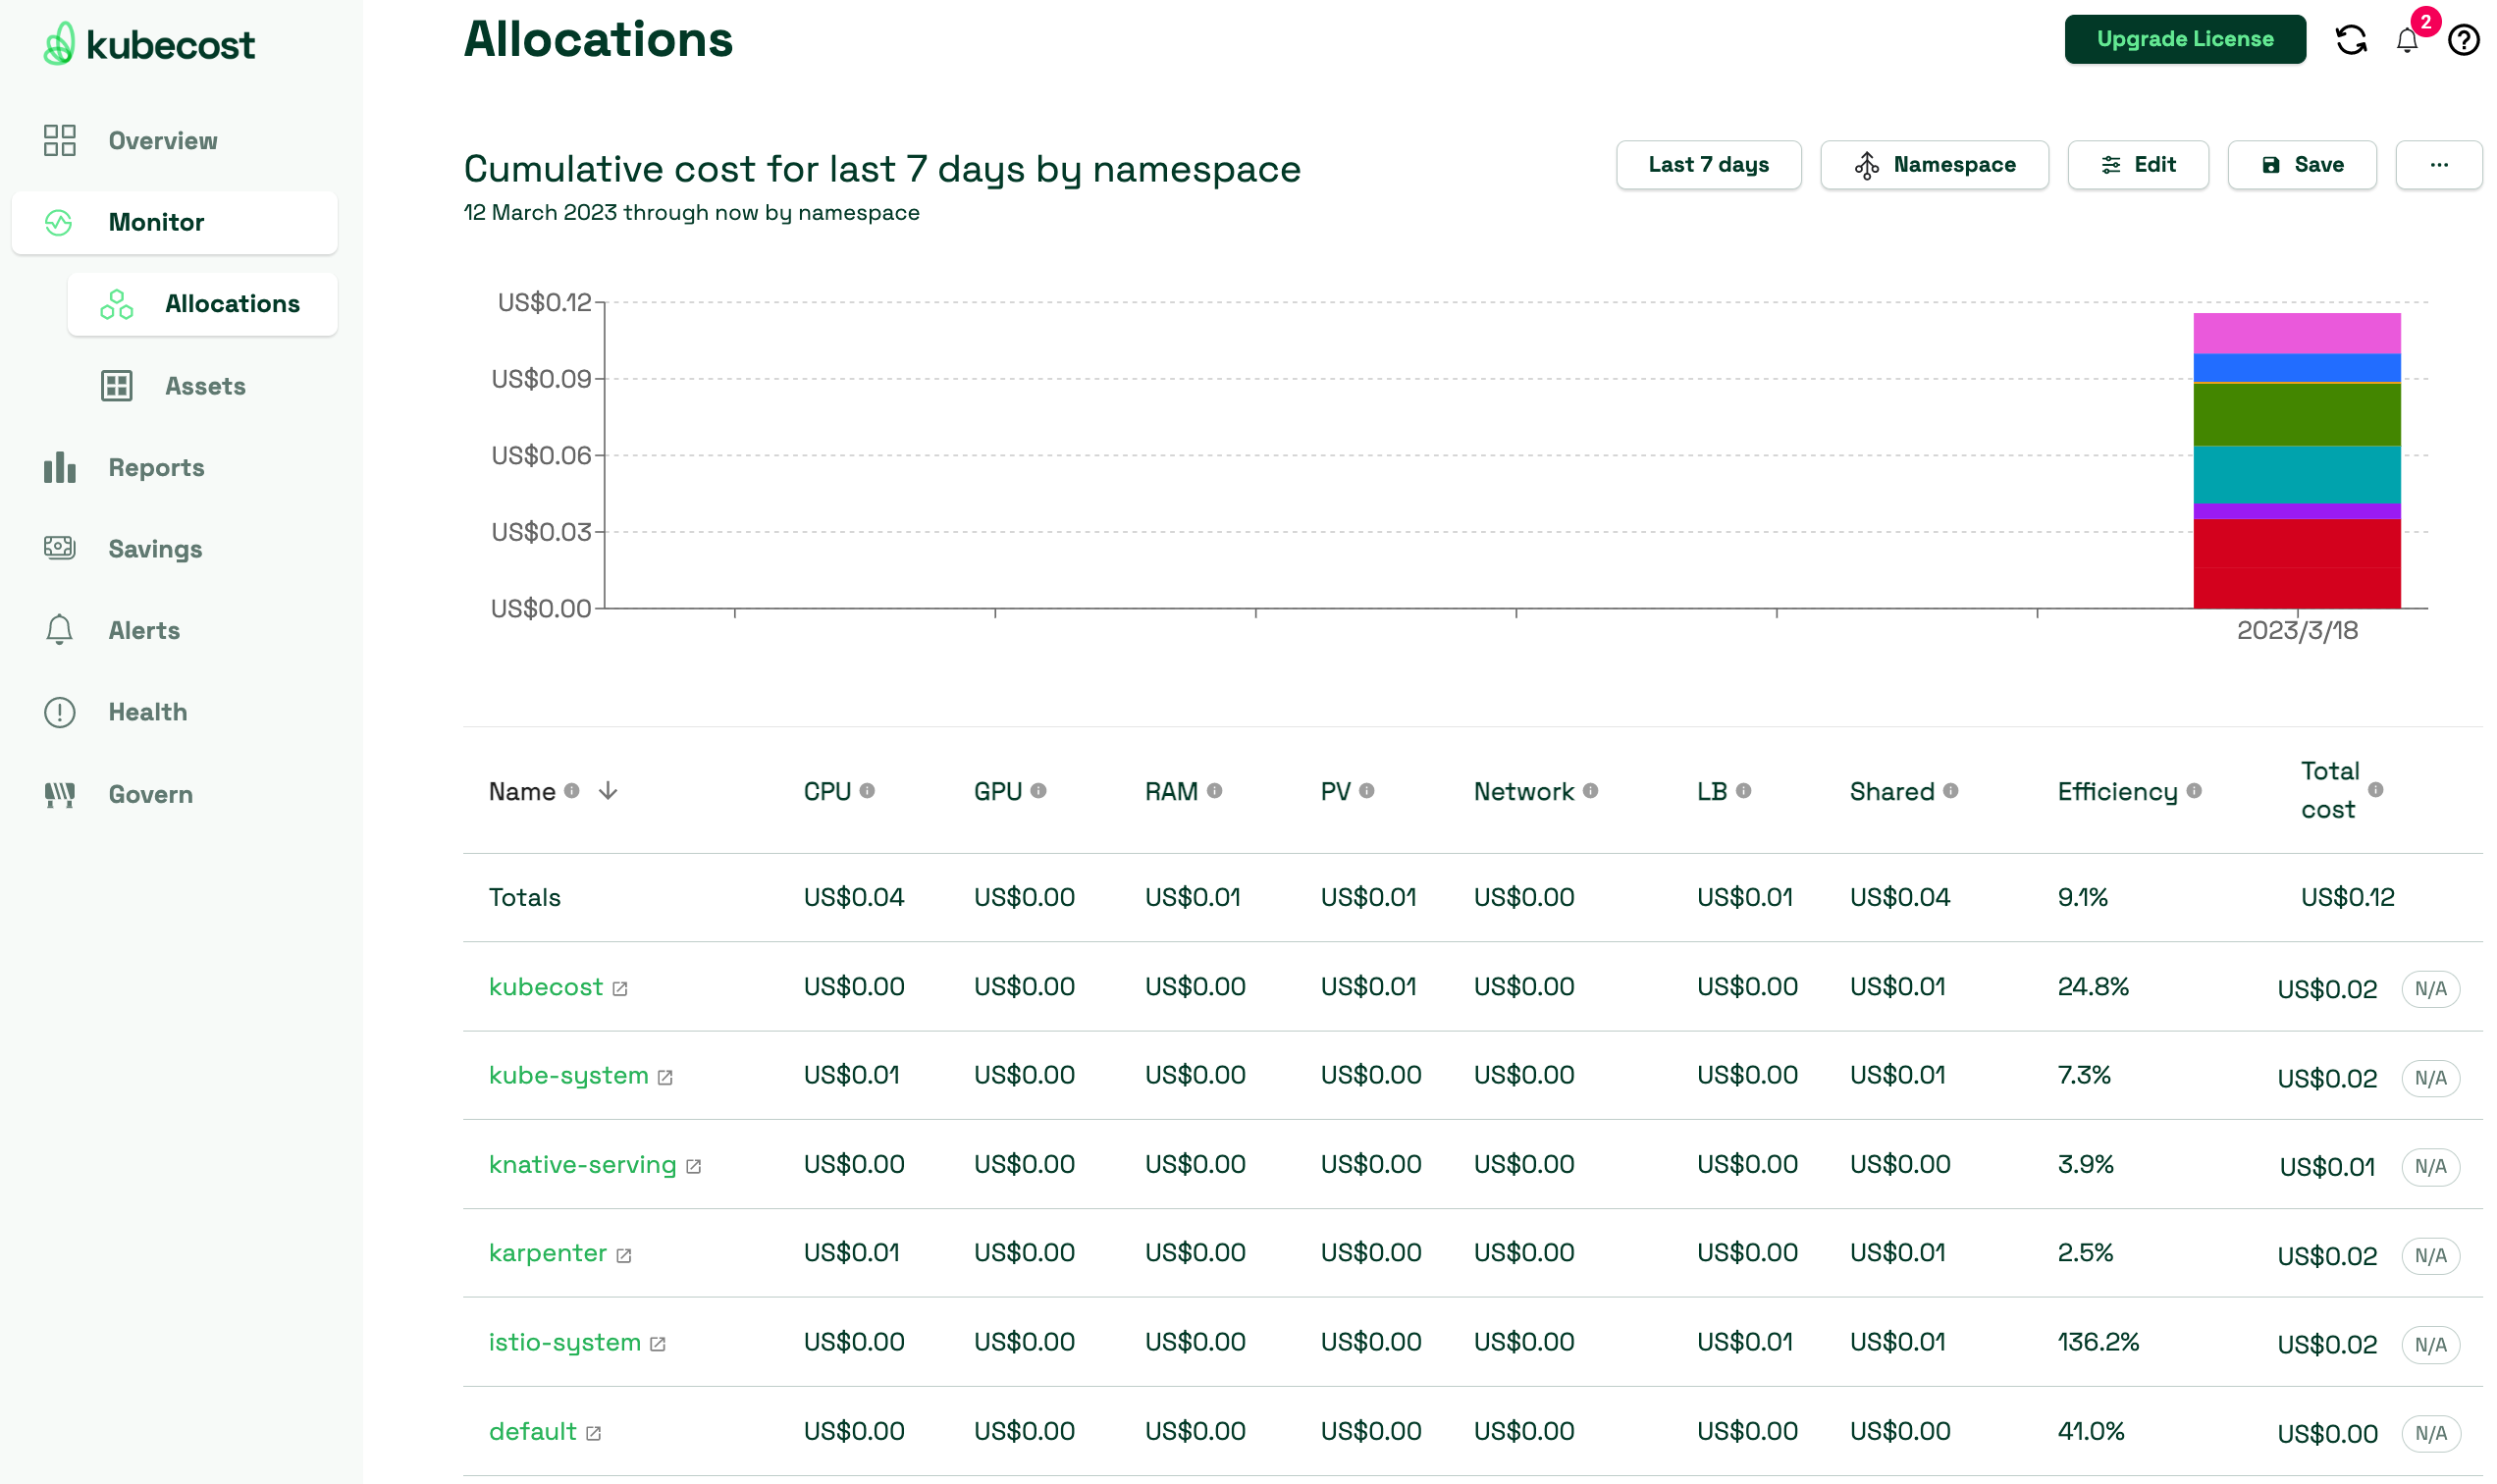
Cost allocation by namespace
View monthly Amazon EKS costs as well as cumulative costs per namespace and other dimensions up to the last 15 days. This enables you to better understand which parts of your application are contributing to Amazon EKS spend.
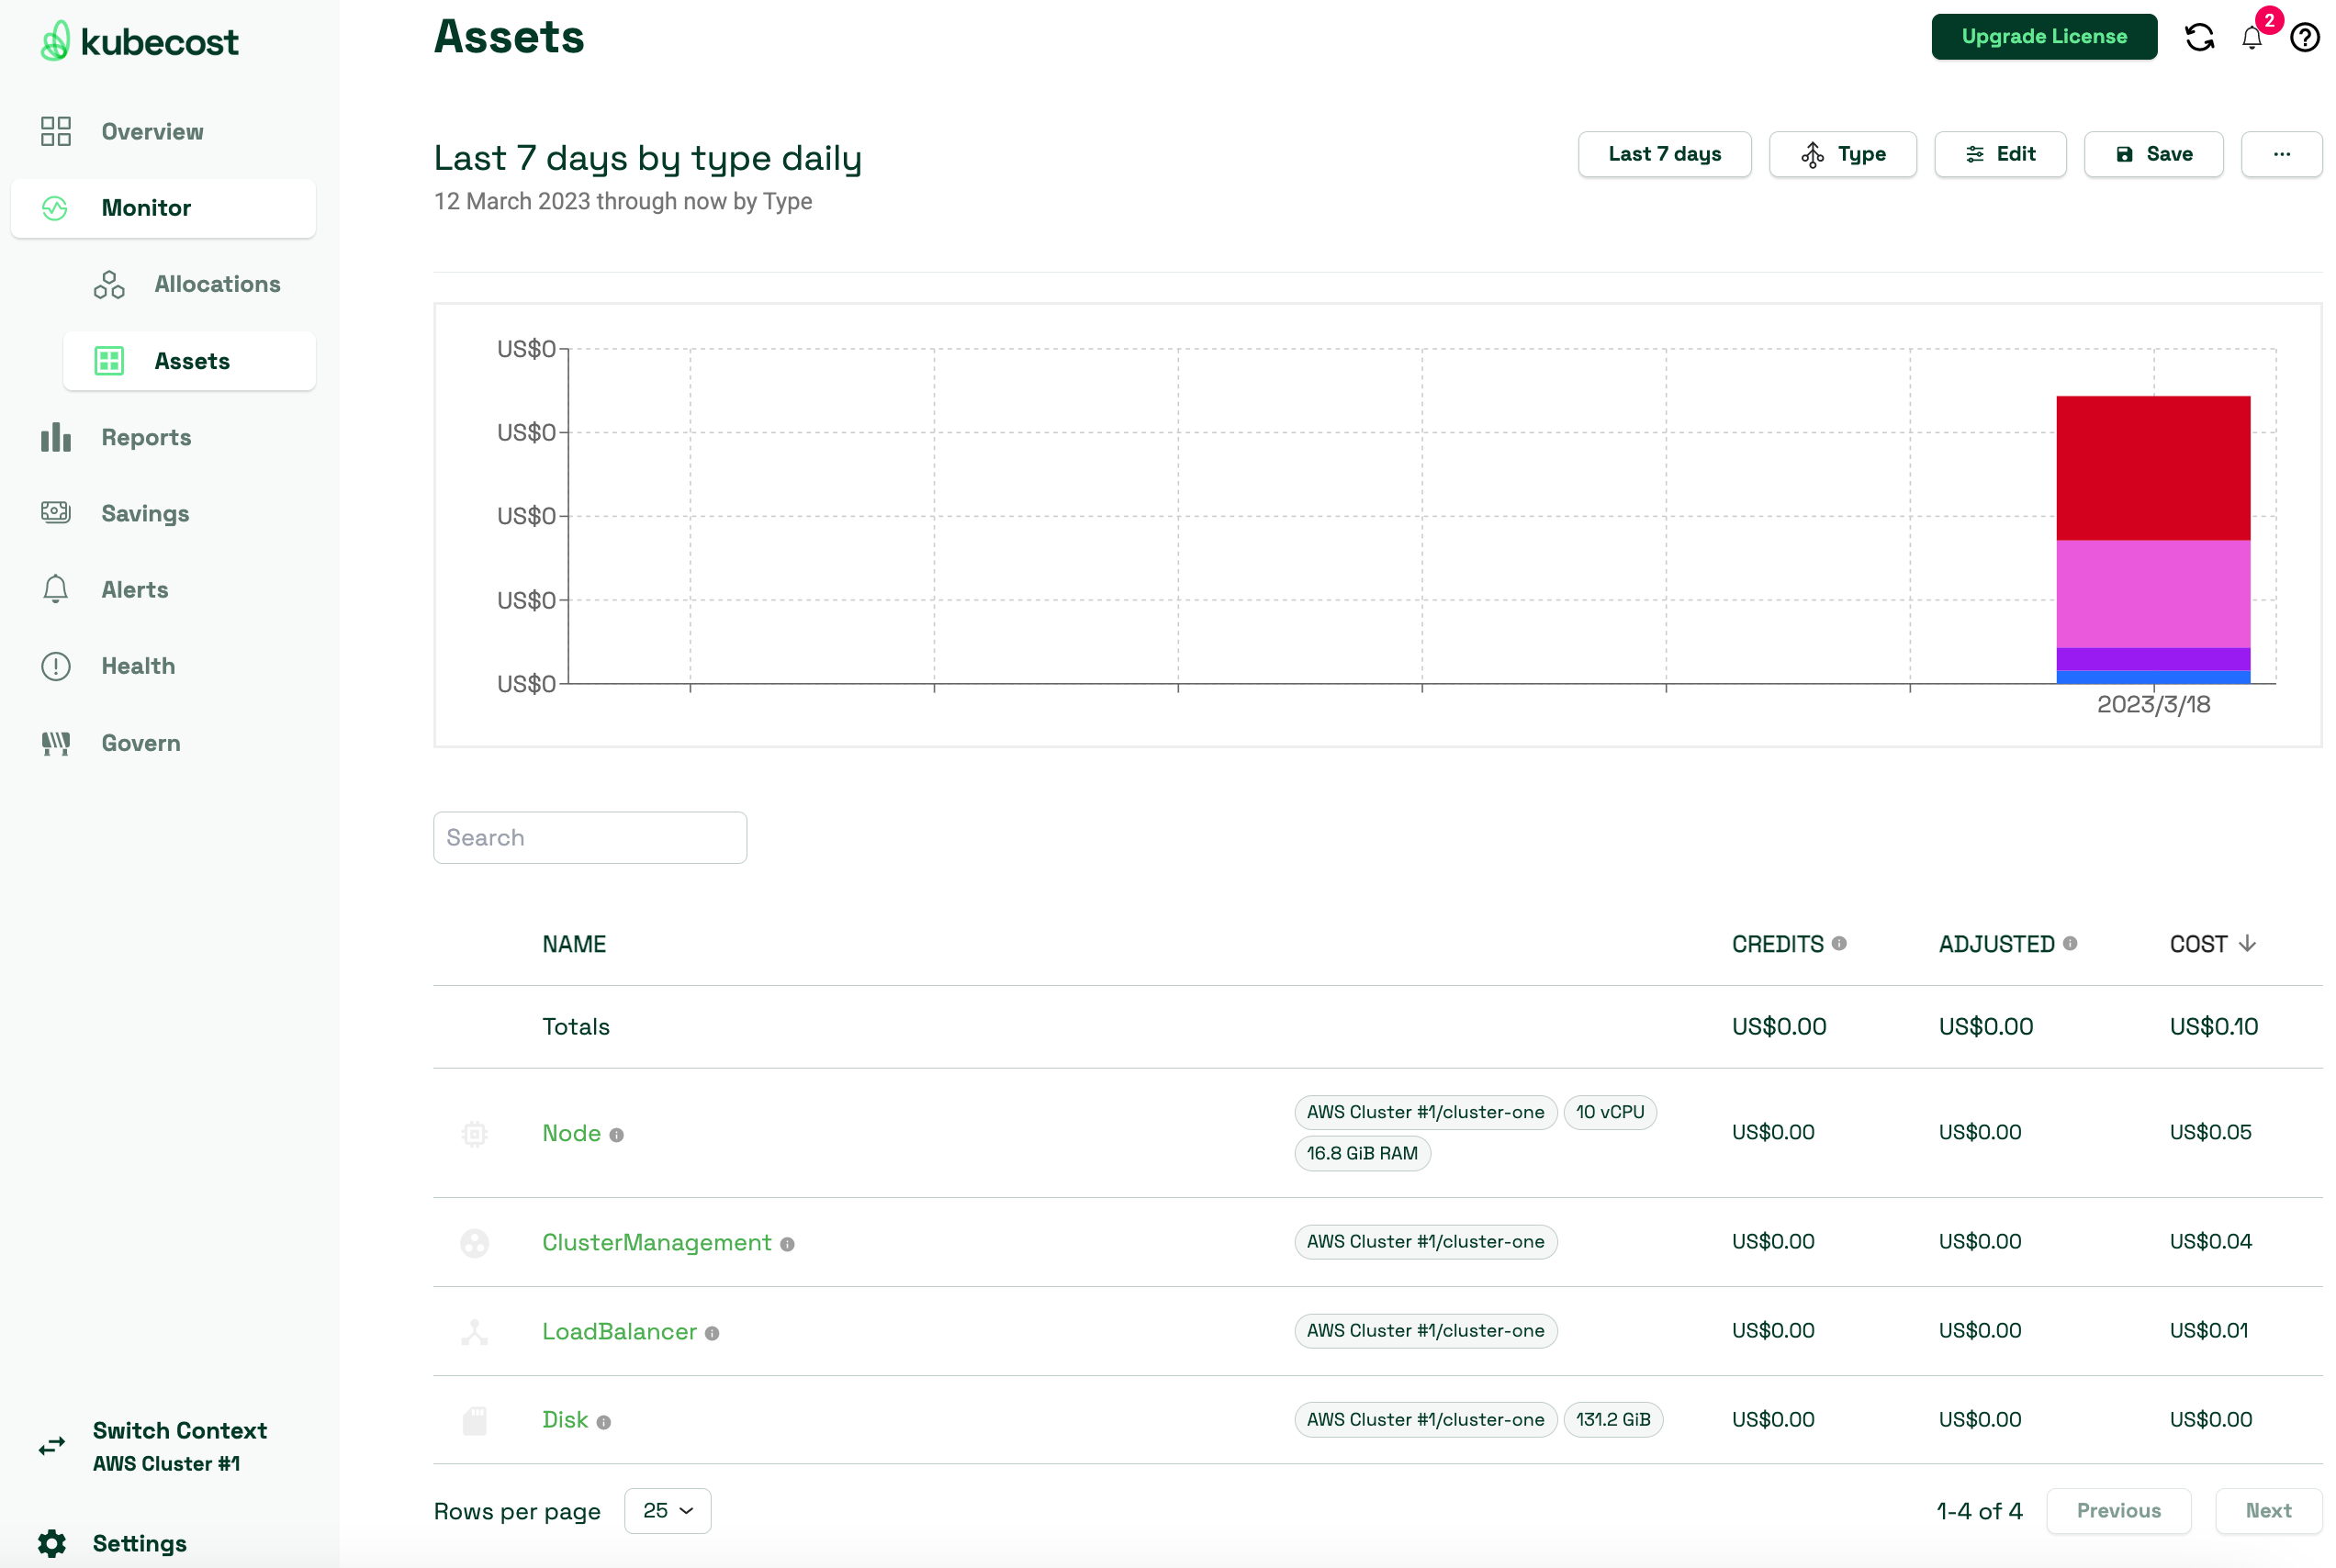
Spend and usage for other AWS Services associated with Amazon EKS clusters
View the costs of AWS infrastructure assets that are associated with their EKS resources.
Export Cost Metrics
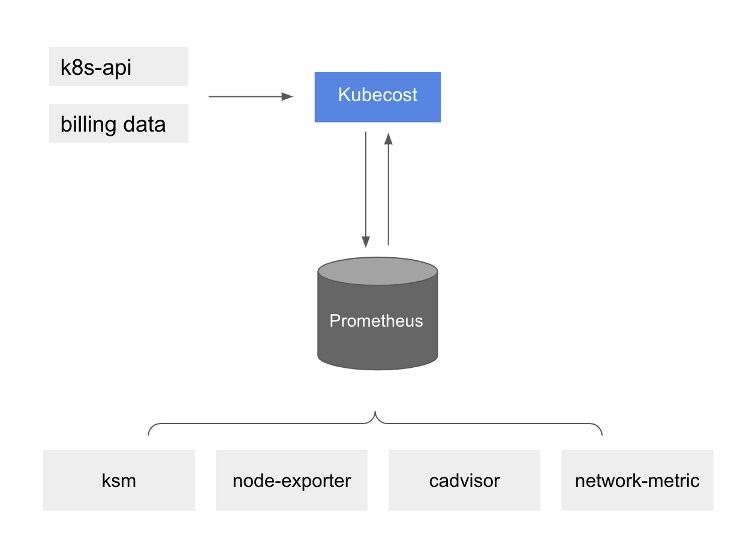
At a high level, Amazon EKS cost monitoring is deployed with Kubecost, which includes Prometheus, an open-source monitoring system and time series database. Kubecost reads metrics from Prometheus then performs cost allocation calculations and writes the metrics back to Prometheus. Finally, the Kubecost front end reads metrics from Prometheus and shows them on the Kubecost user interface (UI). The architecture is illustrated by the following diagram:Kubecost reading metrics
With this pre-installed Prometheus, you can also write queries to ingest Kubecost data in your current business intelligence system for further analysis. You can also use it as a datasource for your current Grafana dashboard to display Amazon EKS cluster cost that your internal teams are familiar with. To learn more about how to write Prometheus queries, review Kubecost’s documentation or use example Grafana JSON models in the Kubecost Github repository as references.
AWS Cost and Usage Report (AWS CUR) integration
To perform cost allocation calculations for your Amazon EKS cluster, Kubecost retrieves the public pricing information of AWS services and resources from AWS Price List API. You can also integrate Kubecost with the AWS CUR to enhance the accuracy of pricing information that is specific to your AWS account (e.g., Enterprise Discount Programs, Reserved Instance usage, Savings Plans, and Spot usage). You can learn more on how the AWS CUR integration works at AWS Cloud Integration.
Label the Node: First, you should label the specific node where you want the pod to be scheduled. You can do this using the
kubectl label command. For example:% kubectl label nodes <node-name> mykey=myvalue
node/<node-name> labeledThis labels the node
<node-name> with mykey=myvalue.Taint the Node: Next, you should taint the node to ensure that no other pods are scheduled on it unless they tolerate this taint. Use the
kubectl taint command like this:% kubectl taint nodes <node-name> disksize=large:NoSchedule
node/<node-name> taintedThis taint ensures that no other pod will be scheduled on this node unless it has a toleration for this specific taint.
Patch file:
spec:
  template:
    spec:
      nodeSelector:
        disksize: large
      tolerations:
        - key: "disksize"
          operator: "Equal"
          value: "large"
          effect: "NoSchedule"
-
References
AWS and Kubecost collaborate to deliver cost monitoring for EKS customers
Cost monitoring
Amazon EKS Integration