Selectively Forward Prometheus Metrics From Agents to AMP
2024年02月21日
With the default configurations, the AMP service has generated considerable cloud expenditure in the past 7 days (approximately).
For more information regarding the setup of Observability, refer to the previous blog post Integrate AWS EKS with AMP using Self-managed Collector and AMG.
- 700M metric datapoints / samples, which corresponds to a billing amount of US$65.
- 0.1 GB per month of storage, which corresponds to the AMP free tier pricing model.
- 17M metric datapoints /query sample processed, which corresponds to the AMP free tier pricing model.
Note
For detailed explanation of the AMP pricing model, refer to Amazon Managed Service for Prometheus pricing.
From the above cost statements, it could be obviously identified that the metric datapoints / samples forwarded from the Prometheus agent to the AMP workspace is the main and single item that forms the AMP related cost. In the next section, I will explain how I deep dived and reduced this cost.
In the future, if new panels are added in the Grafana dashboard, the corresponding metrics will be additionaly forwarded from the Prometheus agent to the AMP.
To sum up, AMG only needs the following 11 metrics on the AMP side:
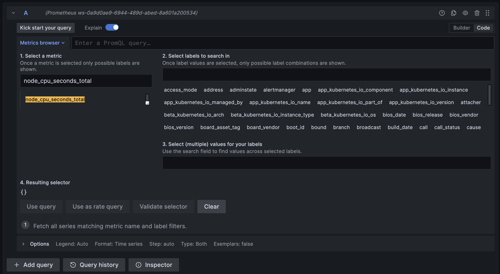
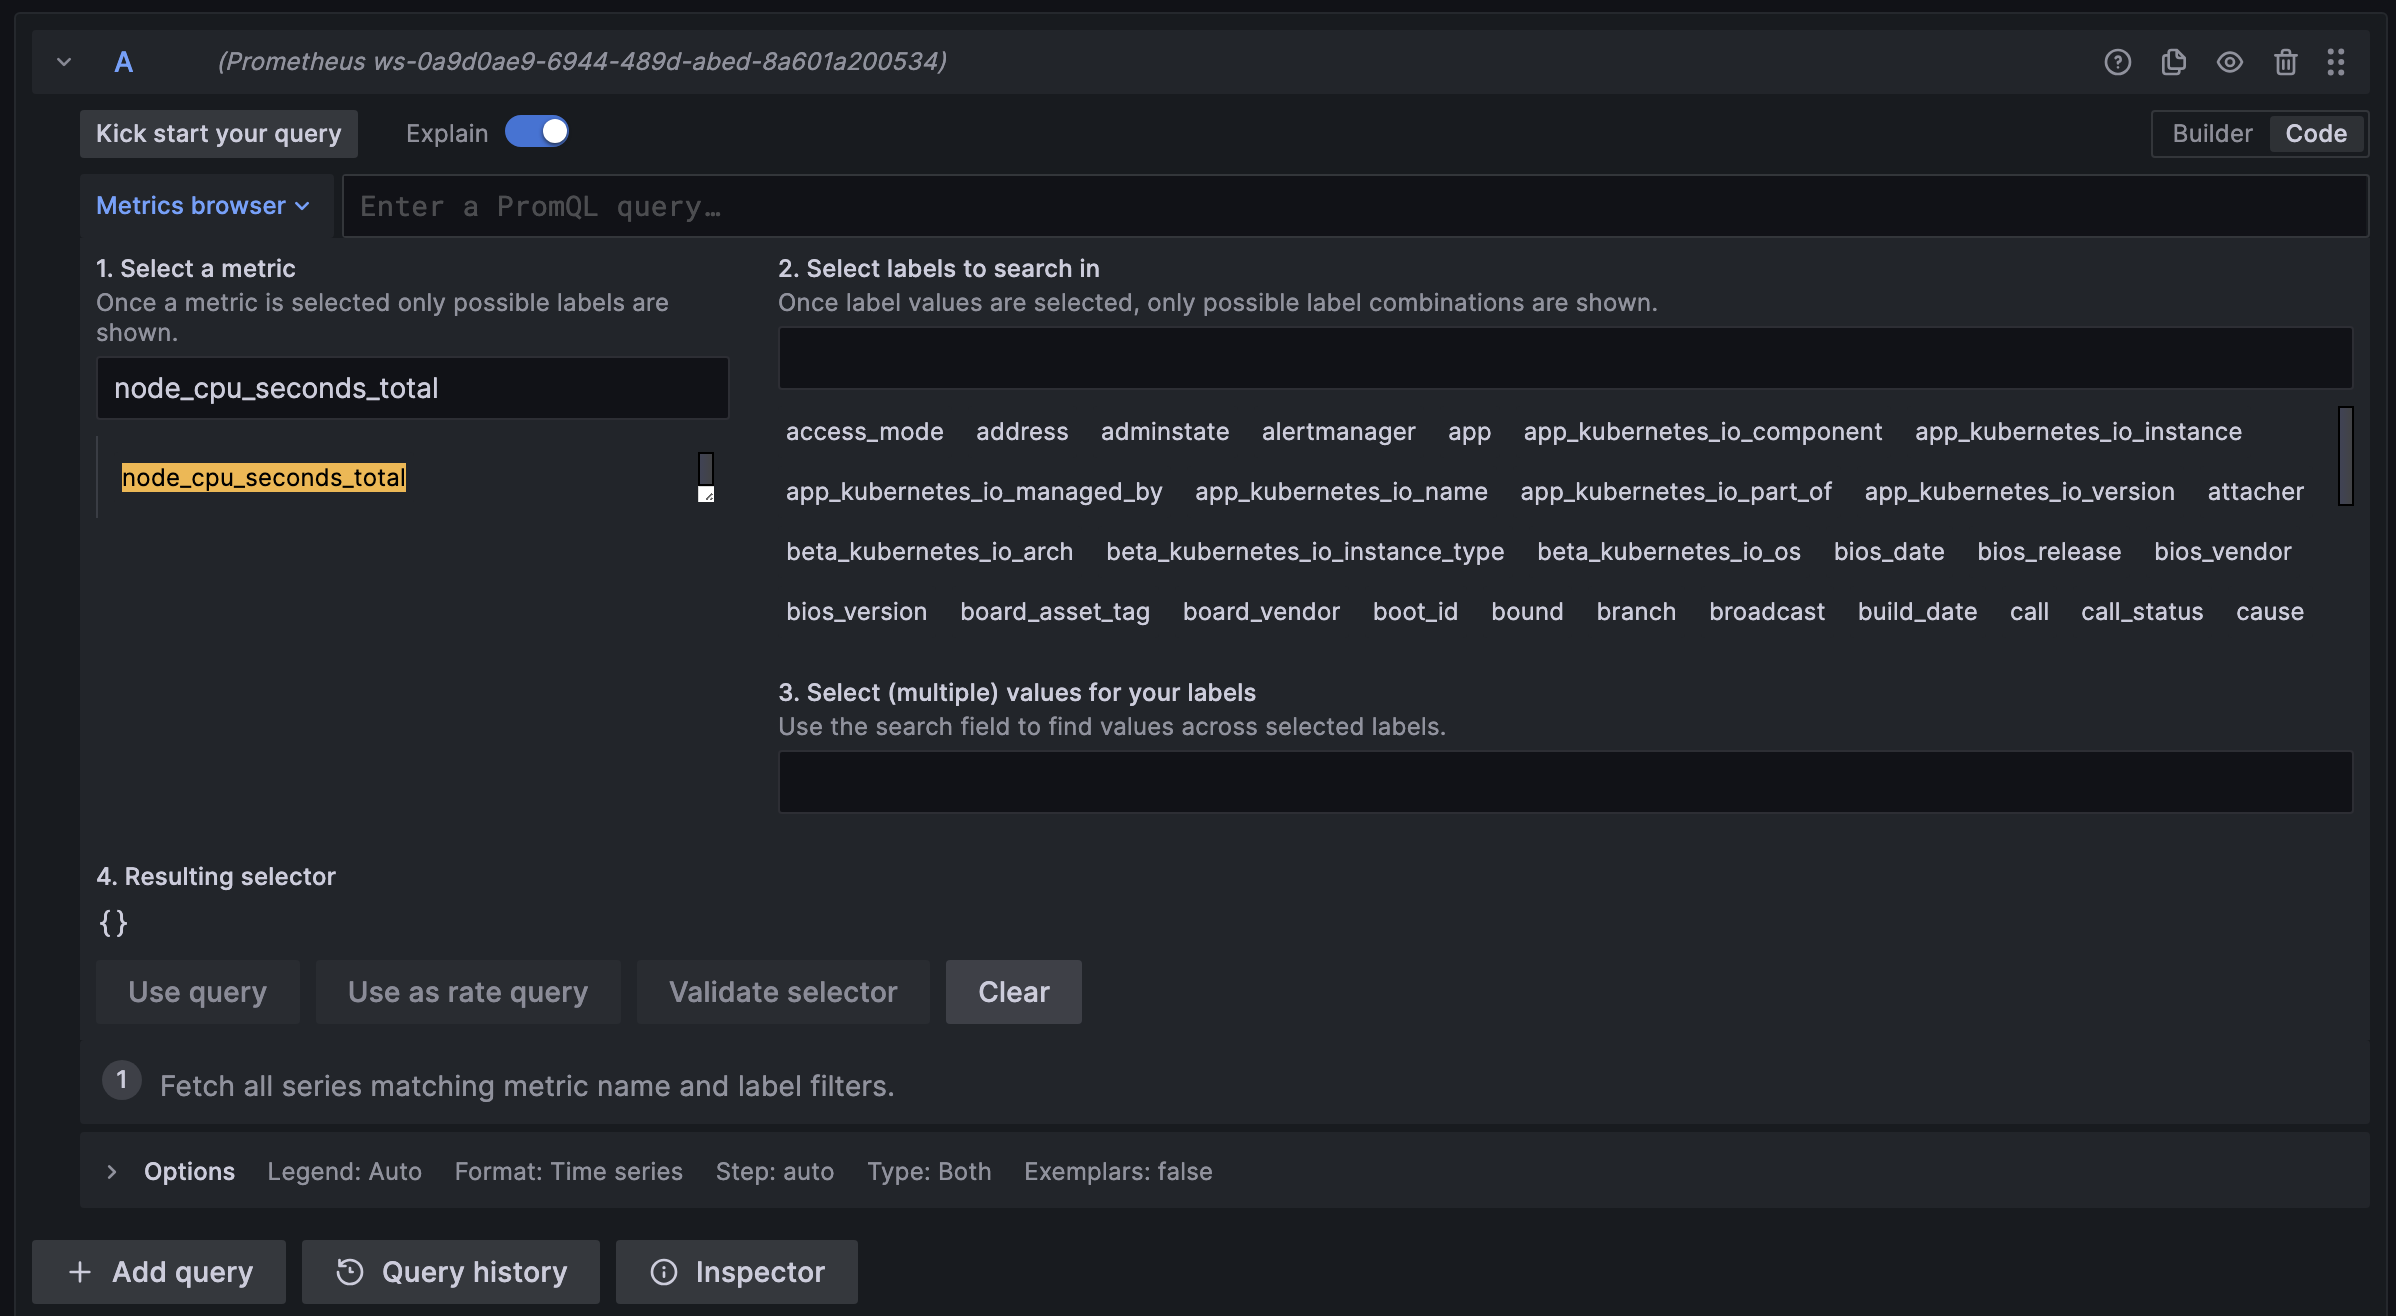
To list all metrics that are available on a Prometheus server from Grafana, you can leverage the Grafana's Explore feature.
1. Open Grafana and log in.
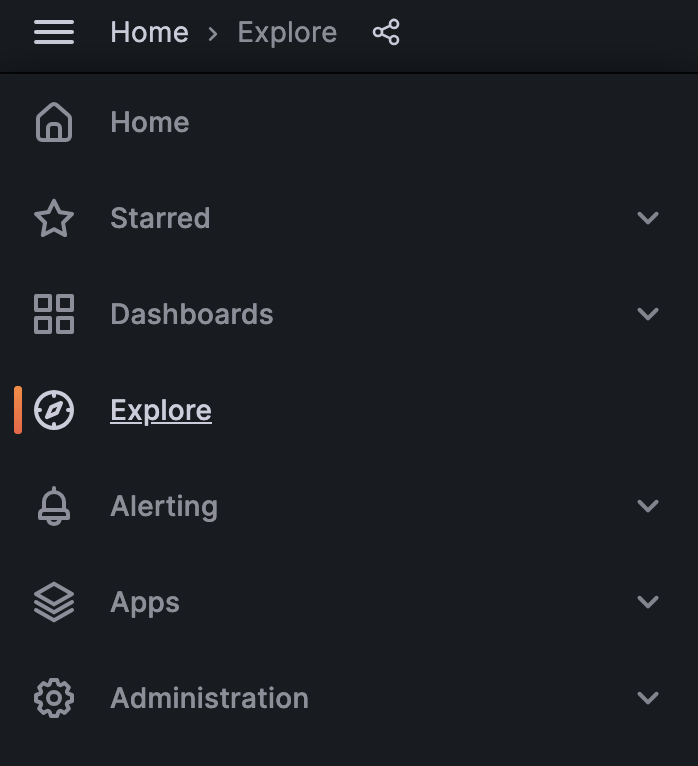
2. Navigate to Explore: Use the compass icon on the left sidebar to open the Explore section.

3. Select Your Prometheus Data Source: At the top, use the dropdown to select the Prometheus data source you have configured in Grafana.
Below configuration:
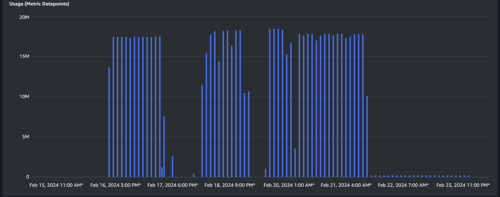
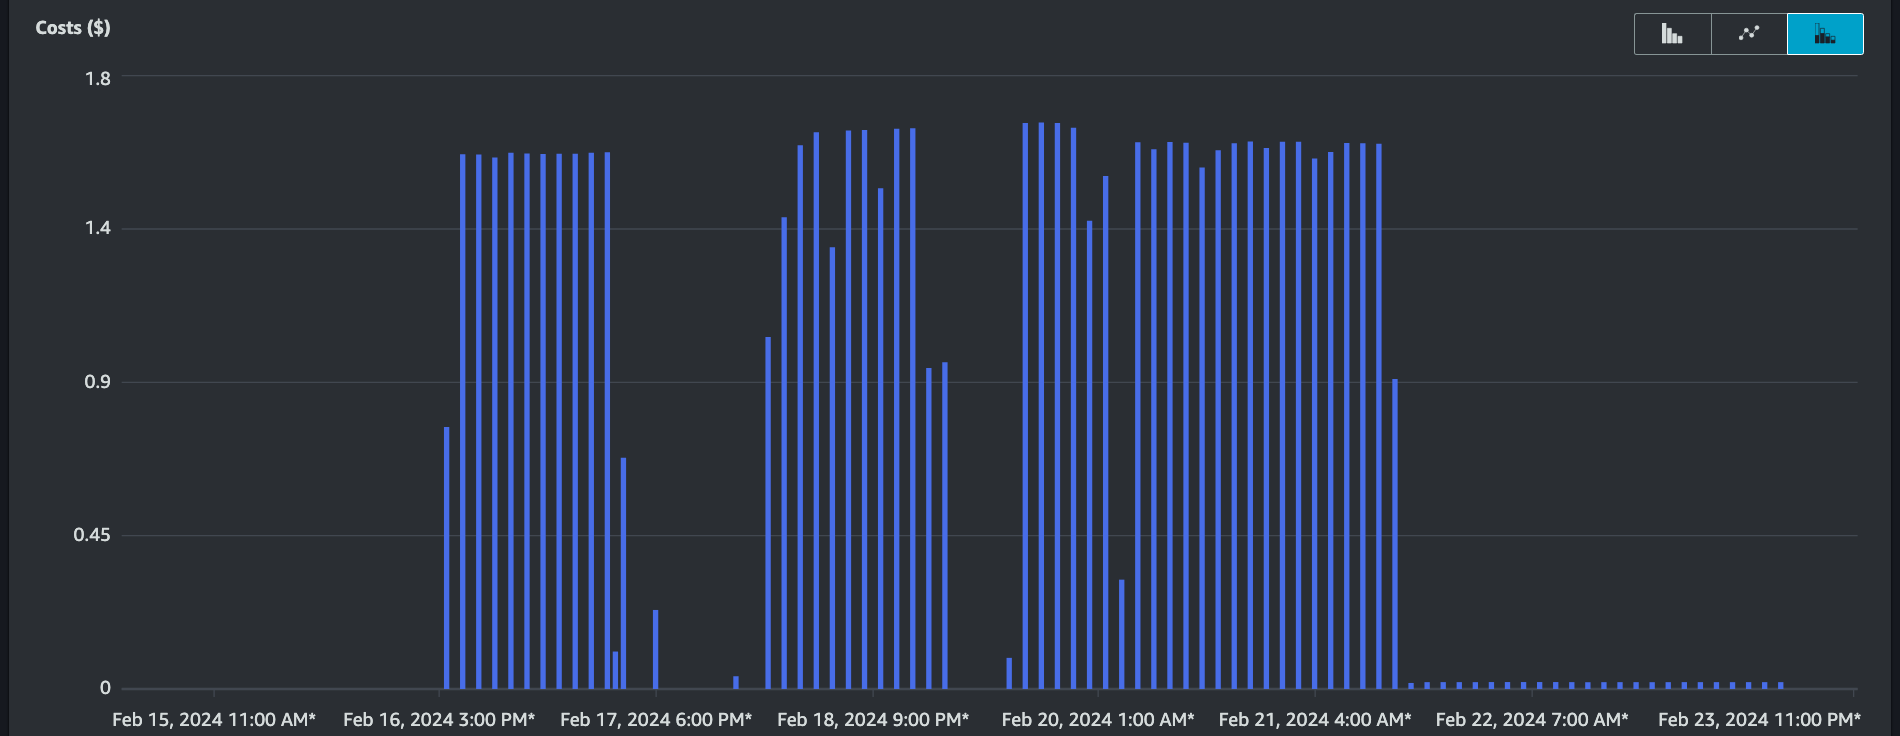
The billing item regarding USW2-AMP:MetricSampleCount has been reduced by 98.7%, and the monthly cost of this billing category has been reduced from US$ 581 to US$ 7.
Costs ($) graph with hourly granularity.

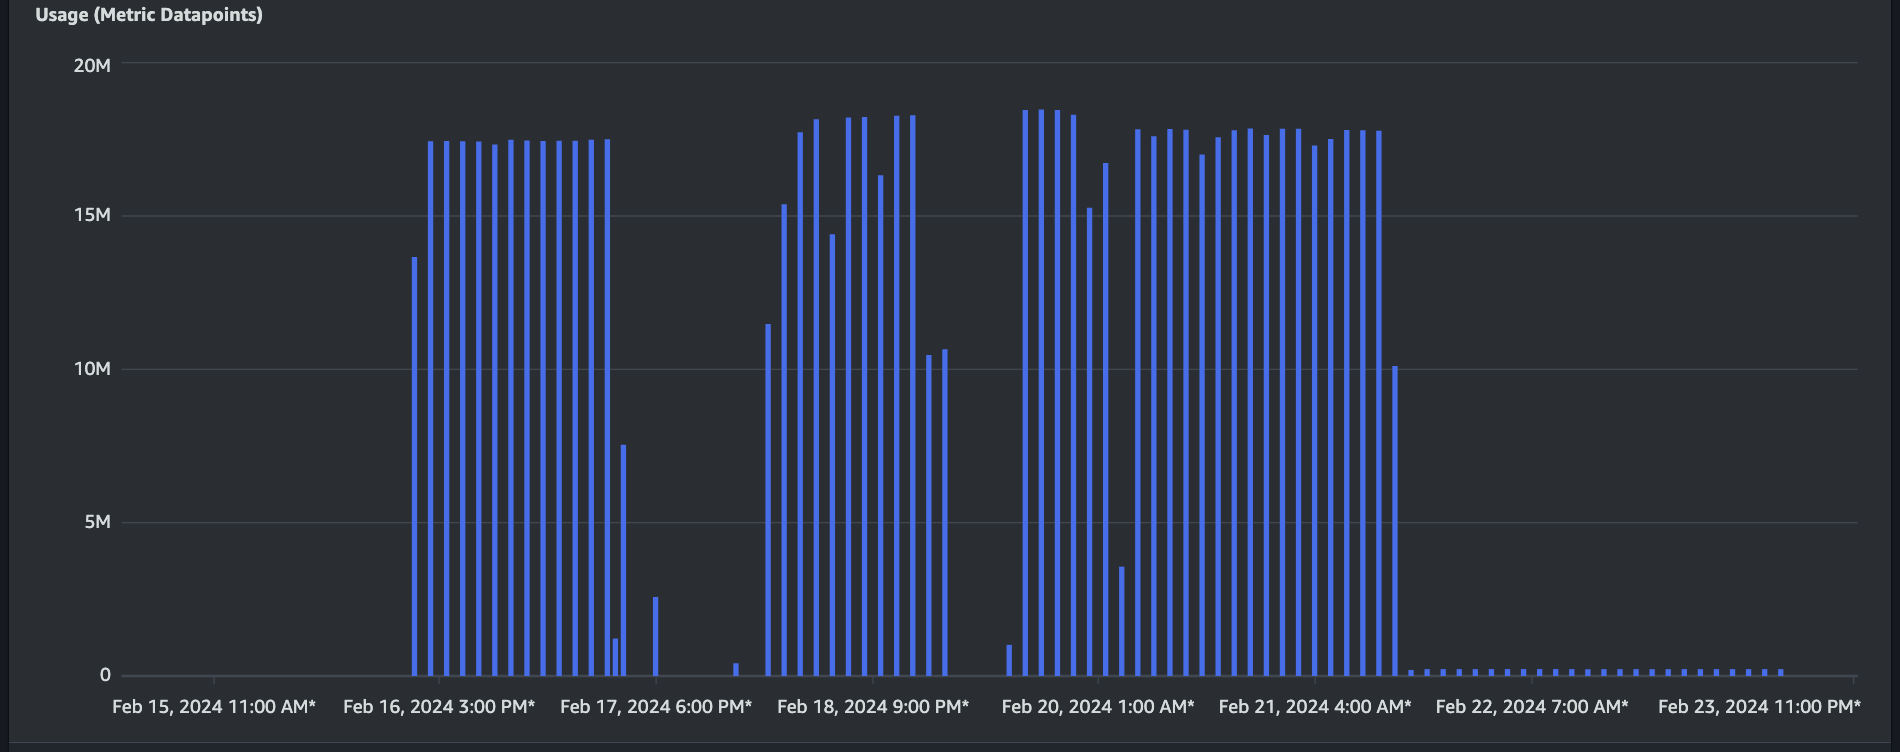
Usage graph (Metric Datapoints) with hourly granularity.
-
In this blog post, I will explain how the AMP cost is reduced while supporting the AMG visualization functionality. This article only focuses on the cost optimization topic regarding AMP, and only focus on reducing the cost from a specific aspect of the AMP related bills.
Prologue
EVERY CENT COUNTS.Background
Currently, the tianzhui.cloud web-site have several panels visualized using AMG dashboard.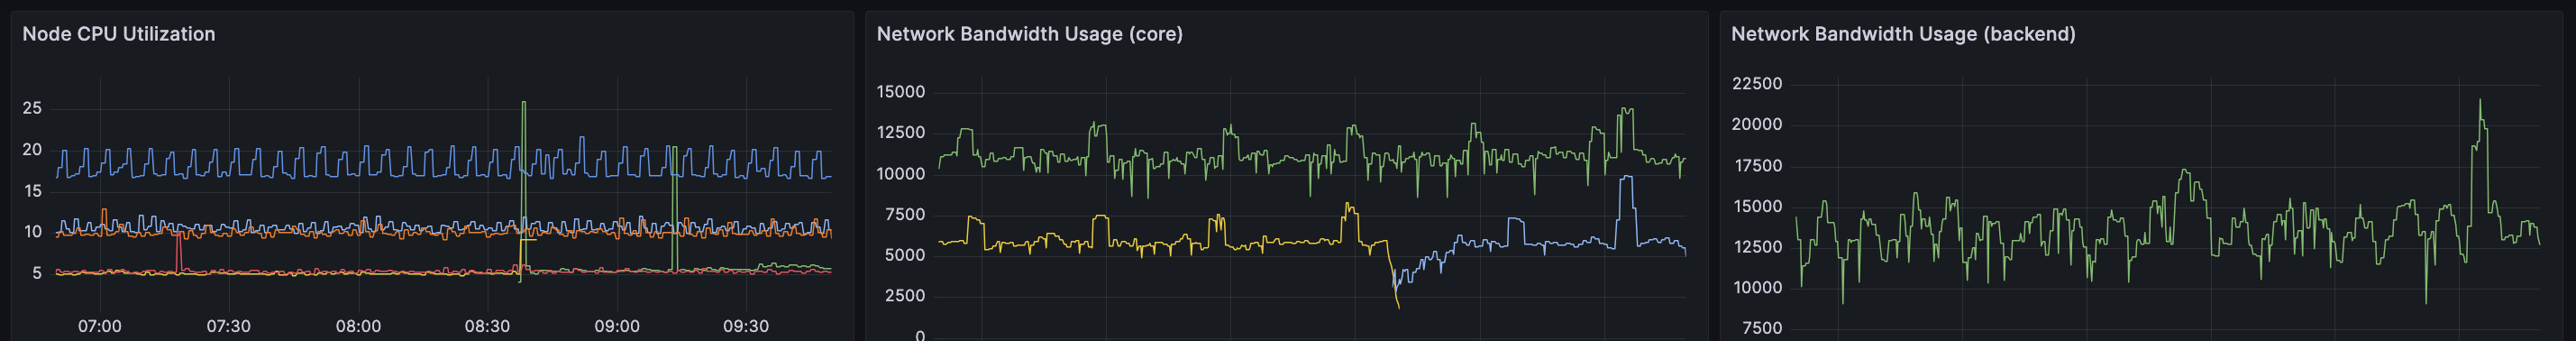
With the default configurations, the AMP service has generated considerable cloud expenditure in the past 7 days (approximately).
For more information regarding the setup of Observability, refer to the previous blog post Integrate AWS EKS with AMP using Self-managed Collector and AMG.
Billing Analysis
It is observed that the AMP has generated the following billing items in the past 7 days (approximately).- 700M metric datapoints / samples, which corresponds to a billing amount of US$65.
- 0.1 GB per month of storage, which corresponds to the AMP free tier pricing model.
- 17M metric datapoints /query sample processed, which corresponds to the AMP free tier pricing model.
Note
For detailed explanation of the AMP pricing model, refer to Amazon Managed Service for Prometheus pricing.
From the above cost statements, it could be obviously identified that the metric datapoints / samples forwarded from the Prometheus agent to the AMP workspace is the main and single item that forms the AMP related cost. In the next section, I will explain how I deep dived and reduced this cost.
Cost Optimization Methodology
Define the Cost Optimization Strategy
From an AMG end-user's perspective, the requirements towards Prometheus is only to collect the metrics that I'm interested which are used for visualization using Grafana. In other words, the requirements towards the metrics forwarded to the AMP is only to support the queries run by Grafana.In the future, if new panels are added in the Grafana dashboard, the corresponding metrics will be additionaly forwarded from the Prometheus agent to the AMP.
Define the Necessary Metrics on the AMP Side
To enumerate all the metrics that are needed for the Grafana queries in PromQL, below PromQL query statements have been analyzed:| Panel Name | PromQL Query Statement | Metric Used |
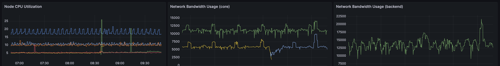
| Node CPU Utilization |
100 - (avg by (instance) (irate(node_cpu_seconds_total{mode="idle"}[5m])) * 100) |
node_cpu_seconds_total |
| Network Bandwidth Usage |
sum(rate(container_network_receive_bytes_total{pod!="",namespace="example"}[5m])) by (pod)+ sum(rate(container_network_transmit_bytes_total{pod!="",namespace="example"}[5m])) by (pod) |
container_network_receive_bytes_total container_network_transmit_bytes_total |
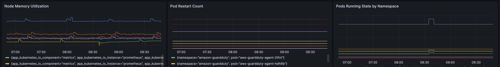
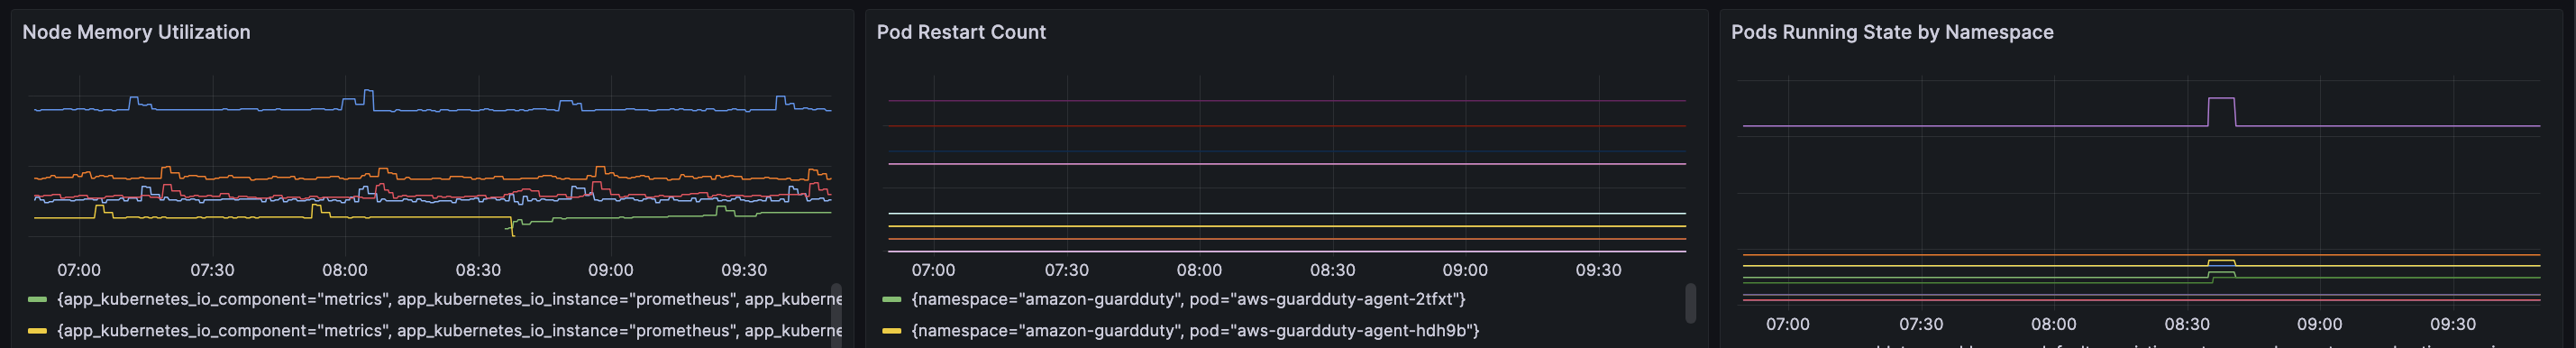
| Node Memory Utilization |
(node_memory_MemTotal_bytes - node_memory_MemAvailable_bytes) / node_memory_MemTotal_bytes * 100 |
node_memory_MemTotal_bytes node_memory_MemAvailable_bytes |
| Pod Restart Count |
sum(kube_pod_container_status_restarts_total) by (namespace, pod) |
kube_pod_container_status_restarts_total |
| Pods Running State by Namespace |
count(kube_pod_status_phase{phase="Running"}) by (namespace) |
kube_pod_status_phase |
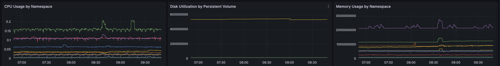
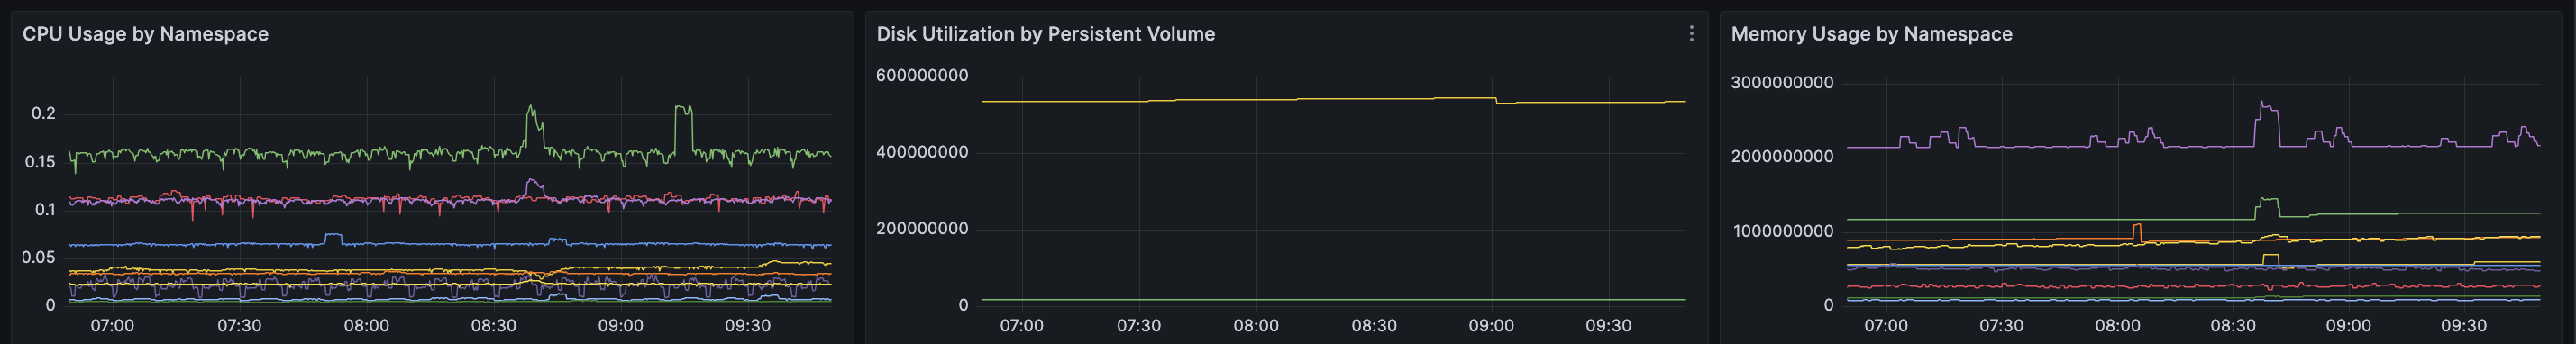
| CPU Usage by Namespace |
sum(rate(container_cpu_usage_seconds_total{container!="",container!="POD"}[5m])) by (namespace) |
container_cpu_usage_seconds_total |
| Disk Utilization by Persistent Volume |
sum by (persistentvolumeclaim, namespace) (kubelet_volume_stats_used_bytes) |
kubelet_volume_stats_used_bytes |
| Memory Usage by Namespace |
sum(container_memory_usage_bytes{container!="",container!="POD"}) by (namespace) |
container_memory_usage_bytes |
| Number of Deployments per Namespace | count(kube_deployment_created) by (namespace) |
kube_deployment_created |
To sum up, AMG only needs the following 11 metrics on the AMP side:
- node_cpu_seconds_total
- container_network_receive_bytes_total
- container_network_transmit_bytes_total
- node_memory_MemTotal_bytes
- node_memory_MemAvailable_bytes
- kube_pod_container_status_restarts_total
- kube_pod_status_phase
- container_cpu_usage_seconds_total
- kubelet_volume_stats_used_bytes
- container_memory_usage_bytes
- kube_deployment_created
(Optional) Confirm the Metric Name
To double confirm if the above metric names are correct, go to Grafana web page (not the AMP console), list all metrics that are on the Prometheus server.To list all metrics that are available on a Prometheus server from Grafana, you can leverage the Grafana's Explore feature.
1. Open Grafana and log in.
2. Navigate to Explore: Use the compass icon on the left sidebar to open the Explore section.
3. Select Your Prometheus Data Source: At the top, use the dropdown to select the Prometheus data source you have configured in Grafana.
Below configuration:
...
serverFiles:
  prometheus.yml:
    remote_write:
    - write_relabel_configs:
        - action: keep
          regex: '^(node_cpu_seconds_total|container_network_receive_bytes_total)$'
          source_labels: [__name__]
        - action: drop
          regex: '.*'
          source_labels: [__name__]
...
has the same result as this configuration:...
serverFiles:
prometheus.yml:
remote_write:
- write_relabel_configs:
- action: keep
regex: '^(node_cpu_seconds_total|container_network_receive_bytes_total)$'
source_labels: [__name__]
...
Conclusion
With below configuration (Helm value file), only the metrics that are currently used by the Grafana dashboard are forwarded to the AMP by Prometheus agent....
serverFiles:
prometheus.yml:
remote_write:
- write_relabel_configs:
- action: keep
regex: '^(node_cpu_seconds_total|container_network_receive_bytes_total|container_network_transmit_bytes_total|node_memory_MemTotal_bytes|node_memory_MemAvailable_bytes|kube_pod_container_status_restarts_total|kube_pod_status_phase|kubelet_volume_stats_used_bytes|container_memory_usage_bytes|kube_deployment_created|container_cpu_usage_seconds_total)$'
source_labels: [__name__]
...
| lineItem/UsageStartDate | lineItem/UsageEndDate | lineItem/ProductCode | lineItem/UsageType | lineItem/UsageAmount | lineItem/UnblendedRate | lineItem/UnblendedCost |
| 2024-02-21T00:00:00Z | 2024-02-21T01:00:00Z | AmazonPrometheus | USW2-AMP:MetricSampleCount | 17841644 | 0.00000009 | 1.60574796 |
| 2024-02-21T02:00:00Z | 2024-02-21T03:00:00Z | AmazonPrometheus | USW2-AMP:MetricSampleCount | 17845427 | 0.00000009 | 1.60608843 |
| 2024-02-21T04:00:00Z | 2024-02-21T05:00:00Z | AmazonPrometheus | USW2-AMP:MetricSampleCount | 17296534 | 0.00000009 | 1.55668806 |
| 2024-02-21T06:00:00Z | 2024-02-21T07:00:00Z | AmazonPrometheus | USW2-AMP:MetricSampleCount | 17512803 | 0.00000009 | 1.57615227 |
| 2024-02-21T08:00:00Z | 2024-02-21T09:00:00Z | AmazonPrometheus | USW2-AMP:MetricSampleCount | 17802462 | 0.00000009 | 1.60222158 |
| 2024-02-21T10:00:00Z | 2024-02-21T11:00:00Z | AmazonPrometheus | USW2-AMP:MetricSampleCount | 17798373 | 0.00000009 | 1.60185357 |
| 2024-02-21T12:00:00Z | 2024-02-21T13:00:00Z | AmazonPrometheus | USW2-AMP:MetricSampleCount | 17783600 | 0.00000009 | 1.600524 |
| 2024-02-21T14:00:00Z | 2024-02-21T15:00:00Z | AmazonPrometheus | USW2-AMP:MetricSampleCount | 10111983 | 0.00000009 | 0.91007847 |
| 2024-02-21T16:00:00Z | 2024-02-21T17:00:00Z | AmazonPrometheus | USW2-AMP:MetricSampleCount | 196540 | 0.00000009 | 0.0176886 |
| 2024-02-21T18:00:00Z | 2024-02-21T19:00:00Z | AmazonPrometheus | USW2-AMP:MetricSampleCount | 223142 | 0.00000009 | 0.02008278 |
| 2024-02-21T20:00:00Z | 2024-02-21T21:00:00Z | AmazonPrometheus | USW2-AMP:MetricSampleCount | 224352 | 0.00000009 | 0.02019168 |
| 2024-02-21T22:00:00Z | 2024-02-21T23:00:00Z | AmazonPrometheus | USW2-AMP:MetricSampleCount | 223545 | 0.00000009 | 0.02011905 |
Costs ($) graph with hourly granularity.
Usage graph (Metric Datapoints) with hourly granularity.
-